
The Bullwhip Effect in SCM & Push-Pull Boundary Architecture
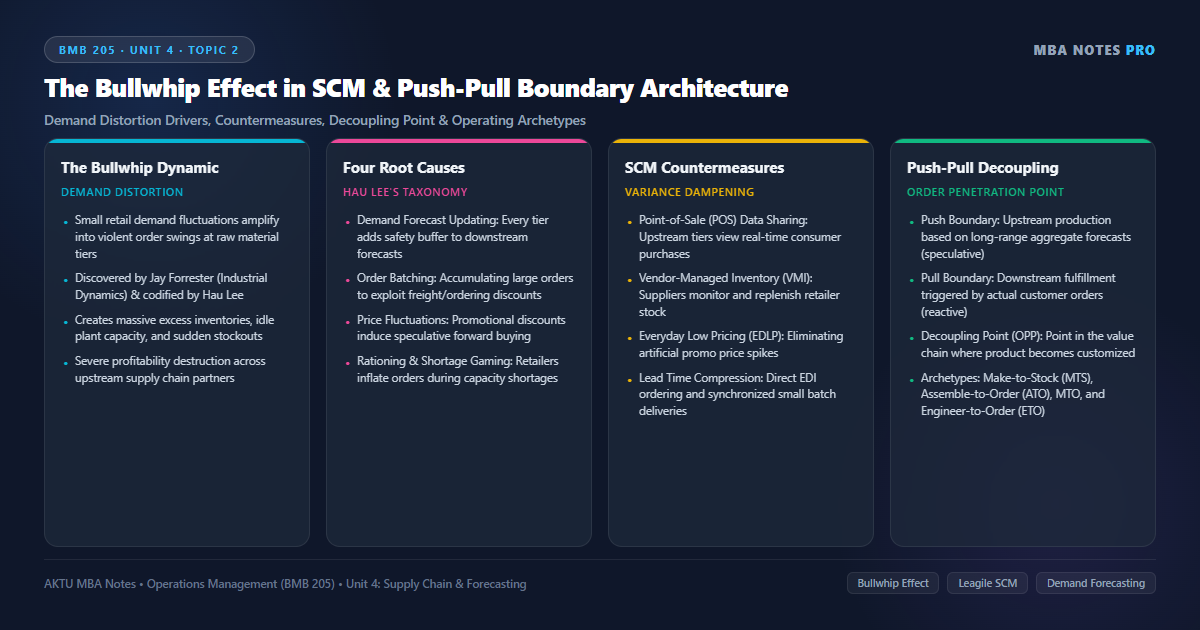
1. The Bullwhip Effect in Supply Chains: Phenomenon & Systemic Destruction
The Bullwhip Effect (also known as the Whiplash Effect or Forrester Effect) is the observed phenomenon in supply chain management where small fluctuations in customer demand at the retail level become progressively amplified into massive, violent swings in order quantities as one moves upstream from retailer to wholesaler, to manufacturer, and finally to raw material suppliers.
Originally identified by MIT’s Jay W. Forrester in 1961 and proven in Stanford University’s famous “Beer Distribution Game”, the Bullwhip Effect illustrates that even in a steady market where retail consumption varies by merely ±5%, raw material suppliers at the far upstream tier experience order volatility swings of over ±50%!
Systemic Costs & Inefficiencies Caused by the Bullwhip Effect:
- Excessive Inventory Stockpiles: Every tier hoards massive safety stocks to protect against artificial order swings, tying up crores in non-productive working capital.
- Severe Capacity Misallocation: Upstream manufacturers invest billions in redundant factory machinery and warehouse space to handle phantom demand spikes, only to suffer idle plant downtime when orders abruptly collapse.
- Missed Productive Lead Times & High Freight Costs: Constant panic-driven order expediting forces suppliers to rely on premium overnight air freight and premium overtime labor.
- Poor Customer Service & High Stockout Rates: Despite massive total supply chain inventory, the wrong products are stocked at the wrong locations, causing frequent retail stockouts.
2. The Four Fundamental Causes of the Bullwhip Effect (Hau Lee Taxonomy)
In their landmark 1997 research paper, Stanford professors Hau L. Lee, V. Padmanabhan, and Seungjin Whang identified the Four Behavioral & Operational Drivers that trigger the Bullwhip Effect:
| Bullwhip Cause | Underlying Operational Mechanism | Proven SCM Strategic Countermeasure |
|---|---|---|
| 1. Demand Forecast Updating | Each supply chain tier uses the orders placed by its immediate customer as its demand signal, recalculating safety stocks. A minor retail demand uptick leads the retailer to order more, the wholesaler to order even more, and the factory to overproduce exponentially. | Point-of-Sale (POS) Data Sharing: Provide raw material suppliers and manufacturers with direct, transparent electronic access to real-time end-consumer checkout data (via EDI and cloud APIs). |
| 2. Order Batching | Retailers accumulate demand and place large, sporadic orders once a week or month to exploit Full Truckload (FTL) freight discounts and reduce ordering transaction overhead, creating artificial surges followed by long droughts. | Vendor-Managed Inventory (VMI) & Milk Runs: Suppliers manage retail shelves directly, delivering small, frequent mixed-model batches using shared 3PL multi-stop consolidation trucks. |
| 3. Price Fluctuations & Forward Buying | Manufacturers offer temporary trade promotions, volume rebates, or seasonal discounts. Retailers engage in speculative Forward Buying — buying 6 months of stock at the discount price, creating a massive artificial demand spike followed by zero orders for months. | Everyday Low Pricing (EDLP): Eliminate temporary promotional price swings; maintain stable wholesale pricing contracts to ensure smooth, continuous purchasing patterns. |
| 4. Rationing & Shortage Gaming | When a manufacturer faces capacity shortages, it rations supply proportionally (e.g., allocating 60% of each retailer’s order). Anticipating this, retailers artificially inflate their orders (e.g., ordering 1,000 units to secure the 600 they actually need). When capacity expands, orders abruptly evaporate. | Capacity Allocation Based on Past Sales: Allocate limited capacity based on historical past market sales rather than inflated current order requests; penalize order cancellations. |
3. Push vs Pull Supply Chain Systems: Operational Mechanics
In modern operations architecture, supply chains are structured around the operational tension between Push Processes and Pull Processes:
Push Supply Chain (Speculative Model)
- Execution is initiated in anticipation of customer orders based on long-range aggregate forecasts.
- Relies on mass economies of scale, dedicated tooling, and large batch production.
- High finished goods inventory stored in warehouses; high vulnerability to demand forecast errors and product obsolescence.
- Typical Examples: Bulk commodity chemicals, canned consumer foods, standard hardware tools.
Pull Supply Chain (Reactive Model)
- Execution is initiated strictly in reaction to confirmed customer demand.
- Zero finished goods inventory; parts are pulled through the system only as consumed (Kanban).
- High product variety and custom specifications; low inventory carrying costs.
- Typical Examples: Custom laptop assembly (Dell), bespoke luxury tailoring, high-end commercial aircraft.
Bullwhip Effect Amplification Measure & Lead Time Variance Equations
Variables & Notation:
- \text{Var}(\text{Orders}): Variance of replenishment orders placed by a supply chain tier to its upstream supplier
- \text{Var}(\text{Demand}): Variance of end-customer demand observed at the downstream retail point
- L: Supply chain lead time (in days or operational review periods)
- p: Number of observation periods used in moving average demand forecasting
- \text{Bullwhip Ratio} > 1: Indicates demand variability amplification as orders move upstream
Step-by-Step Solved Problem Illustration:
- A consumer goods distributor experiences daily retail sales with variance Var(Demand) = 25 units^2. The replenishment lead time from the central manufacturing plant is L = 4 days, and the distributor forecasts demand using a p = 5 period moving average.
- Step 1: Calculate the theoretical lower bound for the Bullwhip Ratio: Ratio = 1 + (2 × 4 / 5) + (2 × 4^2 / 5^2) = 1 + (8 / 5) + (32 / 25) = 1 + 1.6 + 1.28 = 3.88.
- Step 2: Calculate the resulting Order Variance placed on the upstream plant: Var(Orders) = 3.88 × Var(Demand) = 3.88 × 25 = 97.0 units^2.
- Step 3: Calculate the Standard Deviation of orders: σ_Orders = √97.0 = 9.85 units, compared to σ_Demand = √25 = 5.0 units.
- Operational Interpretation: The upstream manufacturer experiences nearly double the demand volatility of actual consumer consumption (a 288% increase in variance). To dampen this bullwhip distortion, the supply chain must compress lead times (L) and implement vendor-managed inventory (VMI) with point-of-sale (POS) data sharing.
4. The Push-Pull Boundary & Decoupling Point (Order Penetration Point)
Few modern enterprises operate as a pure push or pure pull system. Most sophisticated corporations operate a hybrid Push-Pull Supply Chain separated by the Push-Pull Boundary (also known as the Decoupling Point or Order Penetration Point — OPP).
The Decoupling Point is the specific location in the manufacturing value chain where the product transitions from being a standardized, forecast-driven base component into a customized, customer-driven finished item:
| Operating Configuration | Location of Decoupling Point | Push vs Pull Segmentation | Delivery Speed vs Customization | Representative Industry Example |
|---|---|---|---|---|
| 1. Make-to-Stock (MTS) | Finished Goods Warehouse (Extreme Downstream). | 100% Push through production; Pull begins only at retail checkout purchase. | Immediate delivery off the shelf; zero design customization for consumer. | Packaged consumer FMCG (Colgate toothpaste, Parle-G biscuits, smartphones). |
| 2. Assemble-to-Order (ATO) | Sub-Assembly / Modular Component Stockroom. | Push produces generic modules (motherboards, chassis); Pull triggers final assembly upon customer order. | Short delivery time (2–5 days); high configuration variety (postponement). | Custom PC workstations, automobile modular assembly, Asian Paints retail tinting. |
| 3. Make-to-Order (MTO) | Raw Material Warehouse. | Push procures standard steel coils and plastics; Pull begins with fabrication and assembly. | Long delivery lead times (weeks); complete customer dimensional customization. | Industrial boiler manufacturing, commercial printing, custom precision CNC tooling. |
| 4. Engineer-to-Order (ETO) | Design & Engineering Office (Extreme Upstream). | 100% Pull system; even engineering design and raw material sourcing begin only after contract signing. | Very long lead times (months/years); completely bespoke one-of-a-kind engineering. | Naval warships (Cochin Shipyard), thermal power plant turbines (BHEL), infrastructure bridges. |
Corporate Case Vignette: Procter & Gamble’s (P&G) Discovery of the Pampers Bullwhip & POS Integration
The Bullwhip Effect was famously documented and named by logistics executives at Procter & Gamble (P&G) examining the supply chain for Pampers disposable diapers:
- The Baffling Paradox: End-consumer usage of baby diapers is extraordinarily stable — babies consume diapers at a constant, biologically predictable rate year-round. Yet, P&G executives discovered that orders submitted by regional distributors oscillated wildly, while orders placed by P&G with its plastic resin and cellulose suppliers experienced catastrophic swings of ±60%.
- Diagnosing the Four Culprits: P&G found that periodic quarterly trade promotions caused distributors to forward-buy massive quantities. Furthermore, distributors panicked during minor factory delays, ordering double their requirements to game allocations.
- The Operational Turnaround (VMI & Walmart POS Linkage): P&G partnered with retail giant Walmart to pioneer Vendor-Managed Inventory (VMI). Walmart shared real-time point-of-sale scanner data directly with P&G via EDI. P&G took over responsibility for managing Walmart’s warehouse diaper stock, replenishing shelves automatically based on daily consumption.
- Measurable Impact: P&G eliminated distributor order variance, slashed finished goods inventory carrying costs by over $400 Million, and increased retail on-shelf availability to 99.6%.
Managerial Takeaway: Eliminating the Bullwhip Effect requires replacing speculative order forecasting with transparent, real-time consumer point-of-sale data sharing across all supply chain tiers.
AKTU University Examination Questions: Bullwhip Effect & Push-Pull Systems
Section A (2 Marks Conceptual Questions):
Q1: Define the Bullwhip Effect in Supply Chain Management. (2 Marks)
Q2: What is the ‘Decoupling Point’ in a Push-Pull supply chain? (2 Marks)
Section B / C (10 Marks Detailed Analytical Question):
Q: Explain the Bullwhip Effect with a diagram illustrating demand distortion across supply tiers. Detail Hau Lee’s Four Fundamental Causes (Demand Forecast Updating, Order Batching, Price Fluctuations, and Rationing Gaming) and their strategic countermeasures. Contrast Push and Pull systems, and compare MTS, ATO, MTO, and ETO operating configurations. (10 Marks)
1. Conceptual Definition & Diagram: Draw the classic Bullwhip graph showing smooth consumer demand line versus wild, amplified swings at raw material supplier tier.
2. Hau Lee’s Four Root Causes & Countermeasures: Construct comprehensive 3-column table detailing (1) Demand Forecast Updating → POS Data Sharing, (2) Order Batching → VMI and Small-Batch Milk Runs, (3) Price Fluctuations → Everyday Low Pricing (EDLP), (4) Rationing Gaming → Historical Allocation.
3. Push vs Pull Architecture: Contrast forecast-driven speculative Push vs demand-driven reactive Pull.
4. The Decoupling Point & Operating Archetypes Matrix: Explain MTS (Make-to-Stock), ATO (Assemble-to-Order / Postponement), MTO (Make-to-Order), and ETO (Engineer-to-Order) across inventory location, delivery lead times, and customization flexibility.
5. Corporate Case Reference: Cite P&G’s Pampers diaper bullwhip discovery and Walmart VMI integration.
Discussion & Questions
0 CommentsAcademic insights, questions, and conceptual clarifications from students & faculty.
No questions or comments yet
Have a doubt about this topic, an exam tip, or a conceptual perspective? Start the discussion below!
Leave a Comment / Ask a Question
Your email address will not be published. Required fields are marked *