
ISO 9000:2000 Clauses, Six Sigma DMAIC, Total Productive Maintenance (TPM) & 5S
International Standards, 3.4 DPMO Six Sigma DMAIC, TPM 8 Pillars, OEE Calculation & 5S Workplace Housekeeping
1. ISO 9000:2000 Quality Management System: 8 Principles & 5 Core Clauses
The International Organization for Standardization (ISO) established the ISO 9000:2000 standard as a milestone revision that shifted quality assurance from a rigid documentation-heavy compliance exercise into a dynamic, process-driven Quality Management System (QMS). It emphasizes customer satisfaction, process orientation, and continual improvement.
The 8 Quality Management Principles of ISO 9000:2000
- Customer Focus: Organizations depend on their customers; therefore, they should understand current and future customer needs and strive to exceed customer expectations.
- Leadership: Leaders establish unity of purpose and direction of the organization, creating an environment where people become fully involved in achieving quality goals.
- Involvement of People: People at all levels are the essence of an organization, and their full involvement enables their abilities to be used for enterprise benefit.
- Process Approach: Desired results are achieved far more efficiently when activities and related resources are managed as interconnected processes.
- System Approach to Management: Identifying, understanding, and managing interrelated processes as a cohesive system contributes to organizational effectiveness.
- Continual Improvement: Continual improvement of the organization’s overall performance should be a permanent corporate objective.
- Factual Approach to Decision Making: Effective decisions are based on the systematic analysis of empirical data and information.
- Mutually Beneficial Supplier Relationships: An enterprise and its suppliers are interdependent; collaborative relationships enhance the ability of both to create value.
The 5 Core Process Clauses of ISO 9001:2000
- Clause 4 – Quality Management System: Mandates defining the scope of the QMS, establishing standard operating procedures, and maintaining a formal Quality Manual with document control.
- Clause 5 – Management Responsibility: Requires executive leadership to demonstrate customer commitment, define the quality policy, establish measurable quality objectives, and conduct periodic management reviews.
- Clause 6 – Resource Management: Specifies the provision of competent personnel, ongoing training, suitable physical infrastructure, and an acceptable work environment.
- Clause 7 – Product Realization: Covers the entire operational value chain from customer order intake, engineering design, procurement, manufacturing control, gauge calibration, and product delivery.
- Clause 8 – Measurement, Analysis & Improvement: Governs internal audits, customer satisfaction measurement, monitoring of process KPIs, non-conforming product control, and corrective/preventive actions (CAPA).
Comparative Matrix: ISO 9000 QMS vs. Six Sigma vs. Total Productive Maintenance (TPM)
| Management Dimension | ISO 9000:2000 QMS | Six Sigma (DMAIC) | Total Productive Maintenance (TPM) |
|---|---|---|---|
| Primary Objective | Process consistency, compliance, and international customer assurance | Defect reduction, variation minimization, and near-perfect yield | Zero equipment breakdowns, zero accidents, and zero machine defects |
| Quantitative Target | 100% adherence to standard documented processes | 3.4 Defects Per Million Opportunities (99.99966% yield) | 100% Overall Equipment Effectiveness (World-Class OEE > 85%) |
| Primary Focus Area | Management systems, operating procedures, and audit compliance | Statistical process capability, variance analysis, and root causes | Machine health, operator equipment ownership, and maintenance |
| Implementation Champions | Management Representative (MR) & Quality Auditors | Black Belts, Green Belts, Master Black Belts & Champions | Autonomous Maintenance (Jishu Hozen) teams and maintenance engineers |
| Methodological Driver | Plan-Do-Check-Act & Documented Standard Operating Procedures | DMAIC (Define, Measure, Analyze, Improve, Control) statistical roadmap | The 8 TPM Pillars anchored by autonomous shop-floor cleaning/lubrication |
| Core Metrics | Audit non-conformances, CAPA closure rates, customer complaints | DPMO, Process Capability ($C_p, C_{pk}$), Sigma Level | OEE (Availability × Performance × Quality), Mean Time Between Failures (MTBF) |
| Workplace Impact | Procedural rigor, standardized documentation, global credibility | Data-driven culture, significant financial bottom-line cost savings | Clean, pristine shop floor, high machine uptime, zero catastrophic breakdowns |
2. Six Sigma Methodology: 3.4 DPMO Benchmark & The DMAIC Framework
Pioneered by engineer Bill Smith at Motorola in 1986 and championed globally by Jack Welch at General Electric, Six Sigma is a disciplined, data-driven methodology that seeks to eliminate defects and variation from products, manufacturing processes, and transactional services.
Statistically, a process operating at Six Sigma capability produces process variation so tightly controlled that the specification limits are six standard deviations ($6\sigma$) away from the process mean. Even assuming a standard $1.5\sigma$ long-term process drift, a Six Sigma process achieves a defect rate of no more than 3.4 Defects Per Million Opportunities (DPMO), equivalent to a 99.99966% success rate.
The 5 Phases of the DMAIC Improvement Framework
- Define (D): Develop the Project Charter. Identify the Critical-to-Quality (CTQ) characteristics demanded by the customer. Map high-level processes using SIPOC (Suppliers, Inputs, Process, Outputs, Customers) diagrams.
- Measure (M): Establish a reliable measurement baseline. Conduct Measurement System Analysis (Gage R&R) to ensure instruments are accurate and repeatable. Collect process performance data and calculate baseline DPMO and Sigma level.
- Analyze (A): Analyze process data using statistical tools, hypothesis testing (t-tests, ANOVA), regression analysis, and value stream mapping to identify and validate vital root causes ($X\text{s}$) that drive output variation ($Y$).
- Improve (I): Develop creative solutions to address validated root causes. Utilize Design of Experiments (DOE) to optimize operating parameters. Implement mistake-proofing (Poka-Yoke) mechanisms and pilot test the optimal solution.
- Control (C): Standardize the improved process by updating SOPs. Implement Statistical Process Control (SPC) run charts to monitor performance in real-time. Document financial savings and transition project ownership to process managers.
The Six Sigma Belt Hierarchy
- Executive Sponsor / Champion: C-suite executive who selects strategic projects, removes organizational roadblocks, and allocates financial resources.
- Master Black Belt (MBB): Full-time statistical coach who trains Black Belts, audits technical rigor, and manages enterprise-level Six Sigma deployment.
- Black Belt (BB): Full-time project leader who manages complex, cross-functional DMAIC projects and delivers major bottom-line financial savings.
- Green Belt (GB): Part-time practitioner who works on departmental improvement projects while maintaining regular operational duties.
- Yellow / White Belt: Frontline employee trained in fundamental Six Sigma concepts and basic data collection techniques.
3. Total Productive Maintenance (TPM): The 8 Pillars & Overall Equipment Effectiveness (OEE)
Originated by the Japan Institute of Plant Maintenance (JIPM), Total Productive Maintenance (TPM) is an operational approach that aims to optimize equipment effectiveness, eliminate breakdowns, and promote autonomous operator maintenance throughout the equipment lifecycle.
The 8 Pillars of TPM
- Autonomous Maintenance (Jishu Hozen): Empowers machine operators to take personal ownership of their equipment through daily cleaning, inspection, lubricating, and tightening, detecting early signs of wear before failures occur.
- Focused Improvement (Kobetsu Kaizen): Cross-functional teams target and eliminate the 16 major shop-floor losses through structured problem-solving.
- Planned Maintenance: Maintenance engineers schedule predictive and preventive maintenance routines based on Mean Time Between Failures (MTBF) and Mean Time to Repair (MTTR).
- Quality Maintenance (Hinshitsu Hozen): Designs machine conditions that prevent defects from occurring, tracking machine wear components that directly affect part tolerances.
- Early Equipment Management: Applies lessons learned from existing machines to design new equipment that is easy to operate, clean, inspect, and maintain.
- Education & Training: Multi-skilling operators and technicians in mechanical diagnostic skills, electrical safety, and maintenance mastery.
- Safety, Health & Environment (SHE): Creating an accident-free workplace by eliminating ergonomic hazards, chemical risks, and environmental emissions.
- Office TPM: Streamlining administrative and paperwork workflows, eliminating clerical delays and procurement lead-time bottlenecks.
Six Sigma DPMO & Total Productive Maintenance OEE Solved Numerical Problems
Variables & Notation:
- D: Total number of defects observed in the sample
- U: Total units produced or inspected in the batch
- O: Number of defect opportunities per single unit
- \text{Availability}: \text{Operating Time} / \text{Planned Production Time}
- \text{Performance}: (\text{Total Pieces Produced} \times \text{Ideal Cycle Time}) / \text{Operating Time}
- \text{Quality}: \text{Good Conforming Pieces Produced} / \text{Total Pieces Produced}
Step-by-Step Solved Problem Illustration:
- Problem 1 (Six Sigma DPMO): A smartphone assembly plant inspects 5,000 completed handsets. Each handset has 20 distinct defect opportunities (soldering points, screen alignment, camera focus, etc.). Inspection reveals a total of 75 defects across the batch. Calculate DPMO and approximate Sigma Level.
- Step 1: Total Opportunities = Units (U) × Opportunities per Unit (O) = 5,000 × 20 = 1,00,000 opportunities.
- Step 2: DPMO = (Defects / Total Opportunities) × 1,000,000 = (75 / 1,00,000) × 1,000,000 = 750 DPMO.
- Step 3: Benchmark comparison: A DPMO of 750 corresponds to approximately 4.67 Sigma (superior to standard 3 Sigma which has 66,807 DPMO).
- Problem 2 (OEE Calculation): A CNC milling machine runs an 8-hour shift (480 mins). Planned downtime includes 30 mins lunch and 30 mins scheduled maintenance (Planned Production Time = 420 mins). Unplanned machine breakdown during the shift totals 42 mins (Operating Time = 420 – 42 = 378 mins). The ideal design cycle time is 0.5 minutes per piece. The machine produced 630 pieces, of which 30 were rejected upon inspection (600 good pieces). Calculate Availability, Performance, Quality, and OEE.
- Step 4: Availability Rate = Operating Time / Planned Production Time = 378 / 420 = 0.90 (90.0%).
- Step 5: Performance Rate = (Total Pieces × Ideal Cycle Time) / Operating Time = (630 × 0.5) / 378 = 315 / 378 = 0.8333 (83.33%).
- Step 6: Quality Rate = Good Pieces / Total Pieces = 600 / 630 = 0.9524 (95.24%).
- Step 7: Overall Equipment Effectiveness (OEE) = Availability × Performance × Quality = 0.90 × 0.8333 × 0.9524 = 0.7143 (71.43%).
- Evaluation: While 71.43% exceeds typical unmanaged plant baselines (50-60%), it falls below the World-Class OEE benchmark of 85.0% (Availability ≥ 90%, Performance ≥ 95%, Quality ≥ 99.9%). Management must address operating speed losses to elevate Performance.
4. The 5S Workplace Organization Methodology: Housekeeping & Visual Discipline
Originating as a cornerstone of the Toyota Production System, 5S is a systematic methodology for workplace organization, cleanliness, standardization, and discipline. It establishes that world-class operational efficiency is impossible in a cluttered, disorderly work environment.
The Five Steps of 5S
- 1. Seiri (Sort – छँटाई): Distinguish between necessary and unnecessary items in the workplace. Apply Red Tagging to mark obsolete tools, excess inventory, and broken fixtures, relocating or disposing of them to free valuable floor space.
- 2. Seiton (Set in Order – सुव्यवस्था): Arrange all necessary items so that they are easy to locate, use, and return. Establish ‘A place for everything, and everything in its place’ using shadow boards, floor lane markings, color-coded shelving, and labeled bins.
- 3. Seiso (Shine – स्वच्छता): Thoroughly clean the workplace, machinery, and tools daily. In 5S, cleaning is not mere janitorial work—it is an inspection process where operators detect oil leaks, loose bolts, micro-cracks, and overheating during cleaning.
- 4. Seiketsu (Standardize – मानकीकरण): Establish visual standards, cleaning schedules, and standardized operating checklists so that the first 3Ss are practiced consistently across all shifts.
- 5. Shitsuke (Sustain – अनुशासन): Build self-discipline and institutional habit through regular 5S audits, management Gemba walkthroughs, team scorecards, and continuous recognition.
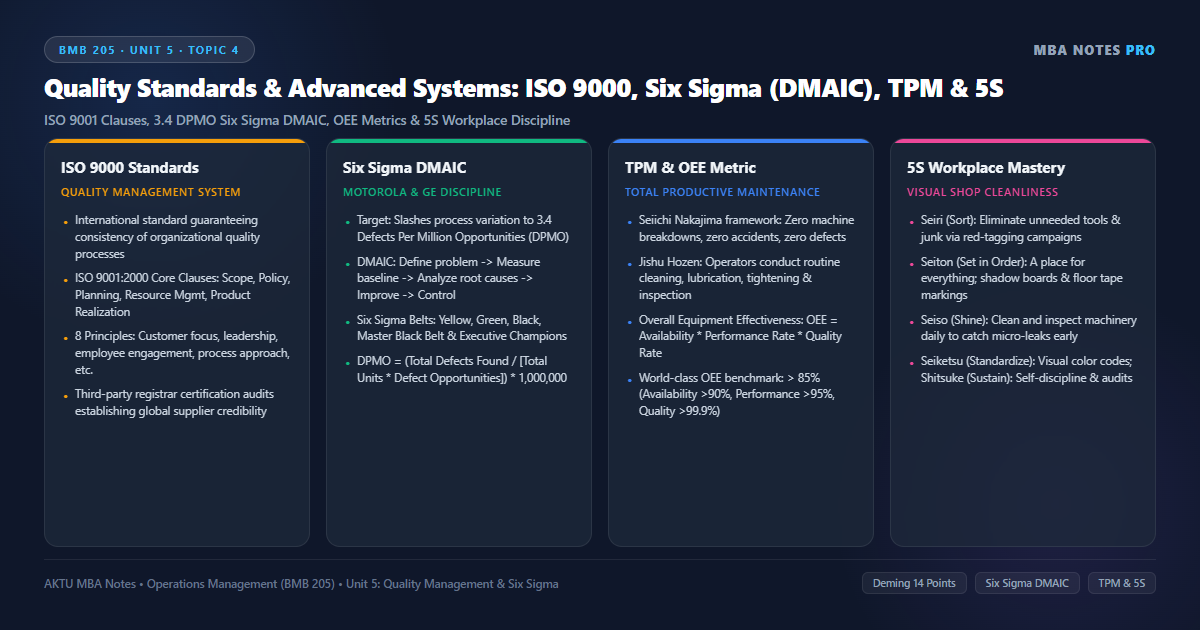
ISO 9000:2000 System
Clauses 4 to 8 governing management responsibility, resource allocation, product realization, and measurement.
Six Sigma DMAIC Engine
Data-driven phases: Define, Measure, Analyze, Improve, Control achieving near-perfection (3.4 DPMO).
TPM & OEE Breakdown
Autonomous Maintenance and planned upkeep driving Overall Equipment Effectiveness (Availability × Performance × Quality).
5S Workplace Foundation
Sort (Seiri), Set in Order (Seiton), Shine (Seiso), Standardize (Seiketsu), and Sustain (Shitsuke).
6. Corporate Case Vignette: Corporate Case Vignette: Wipro Technologies Six Sigma & Tata Motors TPM Implementation
Background: As Indian industries expanded globally in the early 2000s, two distinct organizations leveraged Six Sigma and TPM to achieve international competitiveness: Wipro in software engineering and Tata Motors in heavy commercial vehicle manufacturing.
Six Sigma at Wipro Technologies: Wipro became one of the world’s first IT services firms to achieve enterprise-wide SEI-CMM Level 5 and deploy Six Sigma DMAIC across software development cycles. By defining ‘Defects’ as code bugs per thousand lines of code (KLOC) and billing inaccuracies, Wipro trained over 1,000 Green Belts and 300 Black Belts. The DMAIC cycle reduced software post-delivery defect density by 76% and saved international banking clients over $40 million in prevented system downtime.
TPM at Tata Motors Commercial Vehicle Business Unit (Pune): Tata Motors faced heavy machinery breakdowns, hydraulic oil leaks, and high changeover times on its medium and heavy truck chassis assembly lines. The plant deployed the 8 Pillars of TPM:
- Jishu Hozen (Autonomous Maintenance): Operators conducted daily 15-minute Clean-Inspect-Lubricate (CIL) routines, identifying over 12,000 micro-anomalies (Fuguai) before they caused machine stalls.
- Visual 5S & Shadow Boards: Every maintenance bay was re-engineered with shadow boards and color-coded pneumatic line indicators, slashing tool search times.
- OEE Optimization: Line engineers attacked the ‘Six Big Losses’, reducing die changeover times on heavy press lines from 90 minutes to under 18 minutes (SMED).
Strategic Results: Tata Motors’ Pune plant received the coveted Excellence in Consistent TPM Commitment Award from the Japan Institute of Plant Maintenance. Machine breakdowns plummeted by 88%, assembly line OEE surged from 62% to an outstanding 87.5%, and plant safety records surpassed 10 million accident-free man-hours.
7. AKTU Previous Years Questions & Model Solutions
The following questions reflect the standard question patterns, marks distribution, and evaluation criteria of Dr. A.P.J. Abdul Kalam Technical University (AKTU) MBA Semester Examinations.
A process operating at Six Sigma capability produces no more than 3.4 Defects Per Million Opportunities (DPMO), equivalent to an accuracy rate of 99.99966%.
Overall Equipment Effectiveness (OEE) is a holistic metric that evaluates how effectively a manufacturing operation is utilized compared to its full design potential. Formula: OEE = Availability Rate × Performance Rate × Quality Rate.
The 5S terms are: 1. Seiri (Sort), 2. Seiton (Set in Order), 3. Seiso (Shine / Clean), 4. Seiketsu (Standardize), and 5. Shitsuke (Sustain / Self-Discipline).
Model Answer Structure:
1. Introduction to Six Sigma: Historical origin at Motorola, statistical definition of 3.4 DPMO, difference between 3-Sigma (66,807 DPMO) and 6-Sigma.
2. The 5 DMAIC Phases:
– Define: Project charter, CTQ parameters, SIPOC diagram.
– Measure: Gage R&R, data collection plan, baseline DPMO calculation.
– Analyze: Root cause validation, 5-Why, Pareto, ANOVA/Regression.
– Improve: Solution generation, Poka-Yoke, pilot implementation, DOE.
– Control: Standard operating procedures, SPC run charts, project sign-off.
3. Six Sigma Belt Hierarchy: Executive Sponsor, Master Black Belt, Black Belt, Green Belt, Yellow Belt roles.
4. Total Productive Maintenance (TPM) Overview: Shift from ‘I operate, you fix’ to shared machine ownership. Zero breakdowns, zero accidents, zero defects goals.
5. The 8 Pillars of TPM: Detailed explanation of Autonomous Maintenance (Jishu Hozen), Kobetsu Kaizen, Planned Maintenance, Quality Maintenance, Early Equipment, Education/Training, Safety Health Environment (SHE), and Office TPM.
6. OEE & Six Big Losses: Define OEE = Availability × Performance × Quality. Outline downtime losses, speed losses, and defect losses.
7. Corporate Case Reference: Wipro Technologies and Tata Motors TPM journey.
8. Conclusion: Six Sigma minimizes process variation, while TPM maximizes equipment reliability—together forming the dual pillars of World-Class Manufacturing.
Discussion & Questions
0 CommentsAcademic insights, questions, and conceptual clarifications from students & faculty.
No questions or comments yet
Have a doubt about this topic, an exam tip, or a conceptual perspective? Start the discussion below!
Leave a Comment / Ask a Question
Your email address will not be published. Required fields are marked *