
Macroeconomic and Industry Analysis: The EIC Framework and Life Cycle Dynamics
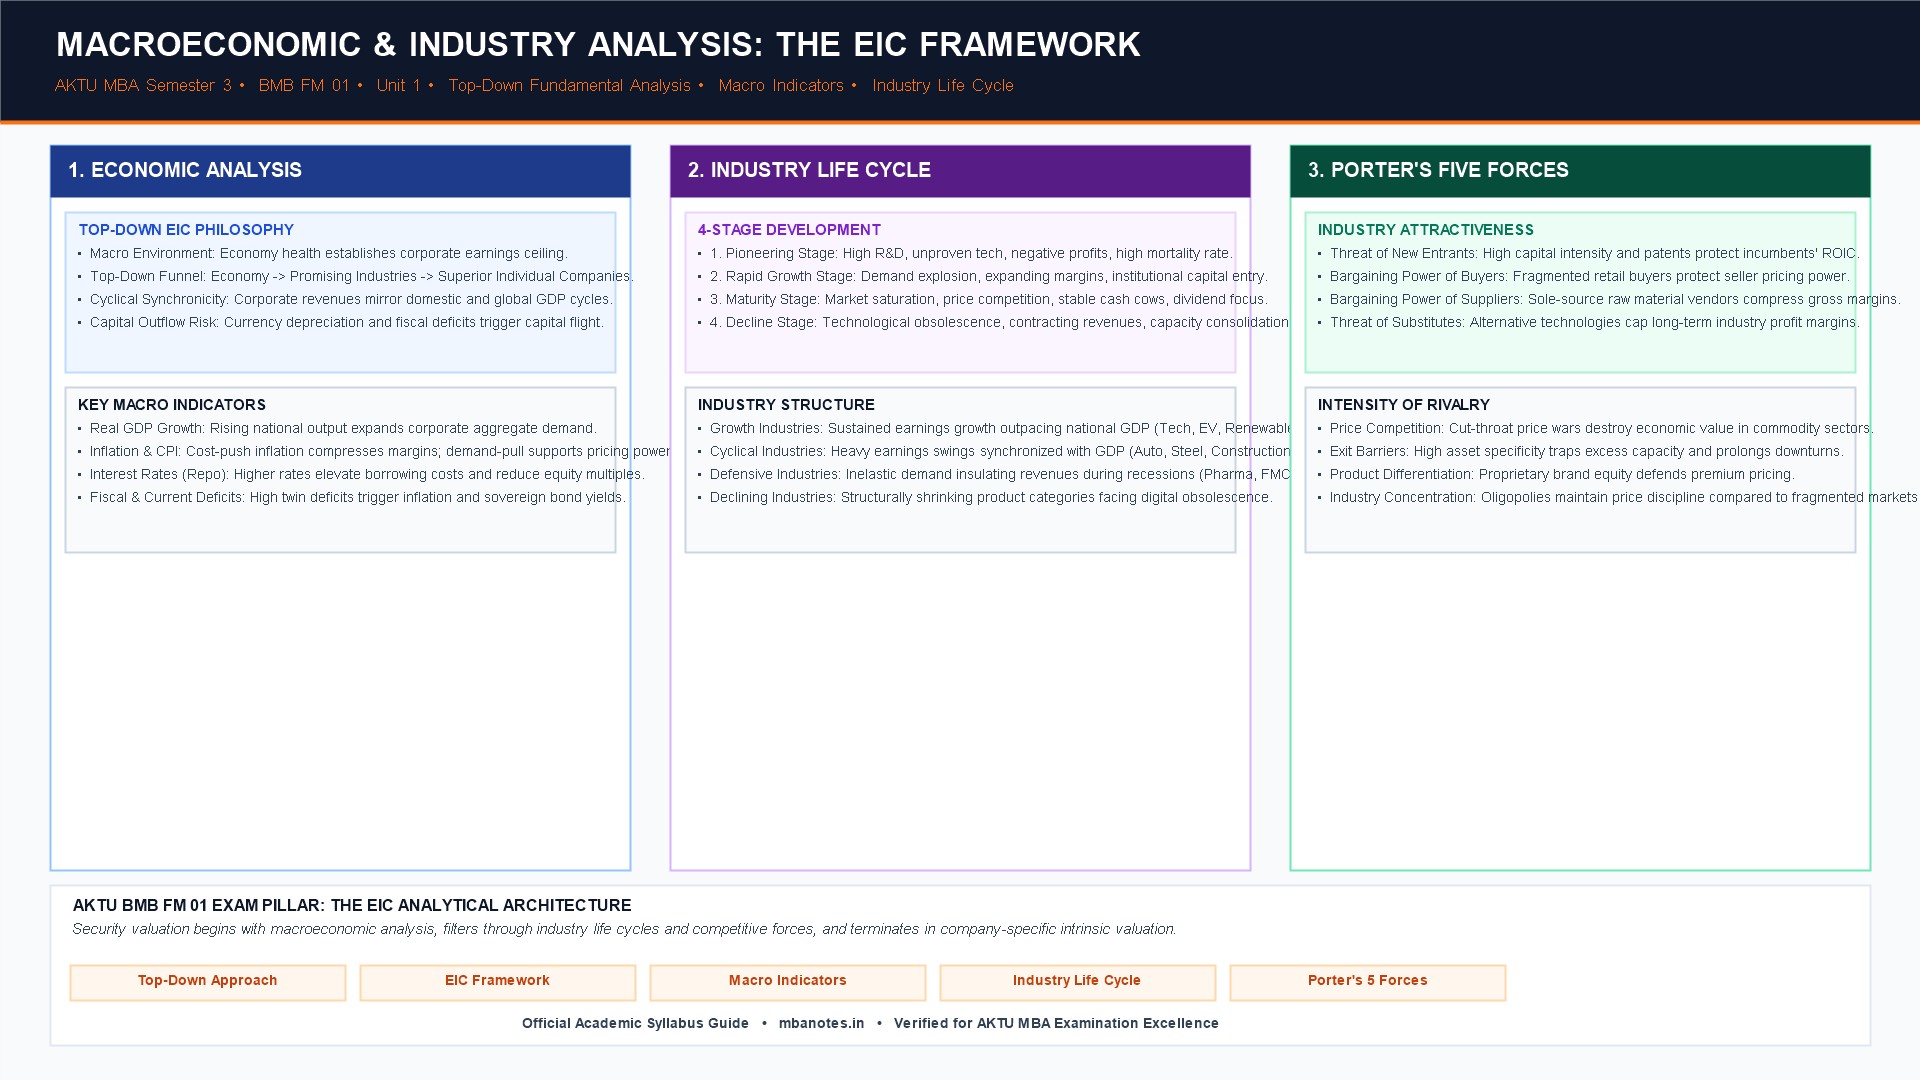
1. Conceptual Foundations: The Top-Down EIC Investment Philosophy
Fundamental security analysis rests on the premise that a security possesses an intrinsic value that is governed by underlying economic, industrial, and corporate earning fundamentals. To identify superior long-term investments, financial theorists advocate the Top-Down EIC (Economy-Industry-Company) Analytical Approach. Rather than starting with individual corporate balance sheets in isolation, the analyst works systematically through three interdependent layers of analysis:
- Macroeconomic Vitality First: Corporate revenue growth cannot outpace macroeconomic gravity forever. A robust, expanding national economy creates broad aggregate demand, whereas a macroeconomic recession depresses consumer discretionary spending across virtually all sectors.
- Sectoral Dispersion: Even in an expanding economy, distinct industrial sectors experience vastly different growth trajectories. For example, during an economic upswing, cyclical industries (capital goods, real estate, automotive) often outpace defensive industries (staples, healthcare).
- Company-Specific Differentiation: Once the most attractive macroeconomic environment and high-growth industry sectors are identified, the analyst examines individual firms within those sectors to find market leaders with durable competitive moats, superior capital efficiency, and ethical corporate management.
- Bottom-Up vs. Top-Down Dichotomy: While bottom-up investors focus purely on individual stock valuation metrics regardless of macroeconomic conditions, the top-down EIC framework protects capital by avoiding strong companies trapped inside structurally decaying industries.
- Synchronized Capital Allocation: Aligning investment portfolios with government infrastructure spending and national industrial policy tailwinds (e.g., Make in India, Production Linked Incentive schemes).
- Global Macroeconomic Linkages: Domestic economies do not exist in a vacuum; cross-border crude oil prices, US Federal Reserve interest rate decisions, and foreign portfolio investment (FPI) flows exert continuous influence on domestic equity markets.
- Risk Mitigation Discipline: The EIC funnel acts as a multi-stage risk filter, weeding out structurally unviable industries before individual balance sheets are analyzed.
2. Macroeconomic Analysis: National Output, Monetary Levers, and Fiscal Balances
Macroeconomic analysis evaluates the overall health, direction, and structural stability of the national economy by tracking key leading, coincident, and lagging macroeconomic indicators.
- Gross Domestic Product (Real GDP Growth): The total monetary value of finished goods and services produced within a country, adjusted for inflation. High real GDP growth (e.g., 6.5% - 7.5%) signals expanding corporate revenues, rising capacity utilization, and buoyant employment.
- Inflation (CPI & WPI): Moderate inflation (3% - 5%) reflects healthy aggregate demand; runaway inflation (8%+) triggers central bank monetary tightening, elevates raw material input costs, and compresses corporate operating profit margins.
- Interest Rates & Monetary Policy (RBI Repo Rate): When the central bank hikes benchmark repo rates to curb inflation, borrowing costs for corporations surge, consumer retail loan demand contracts, and equity valuation discount rates rise, depressing equity multiples.
- Fiscal Deficit Trajectory: The excess of government budgetary expenditures over tax revenues. Excessive fiscal deficits crowd out private corporate borrowing, push sovereign bond yields upward, and fuel inflationary pressures.
- Current Account Deficit (CAD) & Foreign Reserves: A widening trade and current account deficit places downward pressure on the domestic currency (INR depreciation), inflating import bills for crude oil and electronic components.
- Industrial Production Index (IIP) & PMI: The Index of Industrial Production and Purchasing Managers' Index (PMI) provide high-frequency monthly tracking of factory output, new export orders, and manufacturing supply chain vitality.
- Monsoon and Agricultural Output: In emerging agrarian economies like India, a successful southwest monsoon boosts rural household disposable income, directly driving sales of two-wheelers, tractors, consumer durables, and FMCG staples.
3. Industry Analysis: Life Cycle Stages and Structural Industry Classification
Once the macroeconomic environment is established, the analyst investigates the structural attributes and competitive dynamics of target industries utilizing the Industry Life Cycle (ILC) model pioneered by Julius Grodinsky.
- 1. Pioneering Stage: The embryonic, initial phase characterized by revolutionary new technologies, unproven business models, high research and development (R&D) expenditure, and fragmented competition. Mortality rates are exceptionally high; while potential capital appreciation is immense, investment risk is extraordinary.
- 2. Rapid Growth / Expansion Stage: Products achieve market acceptance, industry standards solidify, and weaker competitors are shaken out. Industry revenues and operating cash flows expand at compound rates far outstripping national GDP growth. This stage represents the prime hunting ground for long-term growth investors.
- 3. Maturity / Stabilization Stage: Market penetration approaches saturation, product differentiation narrows, and industry growth moderates to match broad GDP growth. Price competition intensifies, and firms transition into "cash cows," distributing substantial portions of earnings as dividends.
- 4. Decline Stage: The industry faces permanent obsolescence due to technological disruption, regulatory shifts, or changing consumer habits. Total revenue contracts, operating margins erode, and firms consolidate or liquidate assets.
- Growth Industries: Sectors that maintain revenue growth consistently exceeding GDP growth across full business cycles (e.g., Information Technology, Renewable Energy, Electric Vehicles).
- Cyclical Industries: Sectors whose earnings and revenues swing dramatically in sync with the macroeconomic business cycle (e.g., Commercial Vehicles, Basic Steel, Cement, Real Estate).
- Defensive Industries: Inelastic sectors that produce non-discretionary necessities; earnings remain resilient and stable even during deep macroeconomic recessions (e.g., Pharmaceuticals, FMCG Staples, Electric Utilities).
4. Analytical Framework & Comparative Matrix: Porter's Five Forces & Industry Phases
To assess an industry's long-term profitability and economic return on invested capital (ROIC), analysts synthesize Grodinsky's Life Cycle with Michael Porter's renowned Five Forces framework.
Michael Porter's Five Forces of Industry Attractiveness
An industry's long-term sustainable profit pool is determined by five structural competitive forces: Threat of New Entrants (governed by capital intensity and patents), Bargaining Power of Buyers (customer concentration and price sensitivity), Bargaining Power of Suppliers (monopolistic input providers), Threat of Substitute Products (cross-elasticity and price-performance trade-offs), and Intensity of Rivalry among Existing Competitors (fixed-cost burdens and exit barriers).
| Life Cycle Stage | Market Growth Rate | Operating Margins & Profits | Investment Risk Profile | Recommended Strategy |
|---|---|---|---|---|
| 1. Pioneering Phase | Unpredictable, experimental; rapid potential growth. | Negative or negligible; heavy R&D cash burn. | Extremely High; high probability of company failure. | Venture capital, angel funding, small speculative positions. |
| 2. Rapid Expansion | Very High (20% - 40%+ CAGR outstripping GDP). | Rapidly expanding; high operating leverage benefits. | Moderate-to-High; operational execution risk. | Growth investing; re-invest retained earnings; buy market leaders. |
| 3. Maturity Phase | Moderate; tracks broad national GDP growth (4% - 7%). | Stable, predictable cash cows; high return on equity. | Low; established market structures and moats. | Value investing; high dividend yield portfolios; defensive hold. |
| 4. Terminal Decline | Negative growth; structural demand contraction. | Eroding; severe price wars and inventory write-offs. | High capital destruction risk. | Avoid or divest; sell rallies; exploit shorting opportunities. |
6. Corporate Case Vignette: The Indian Electric Vehicle (EV) Ecosystem in EIC Analysis
Tata Motors & the Indian EV Revolution: Applying Top-Down EIC in Practice
Macroeconomic Analysis (E): India's macroeconomic landscape in 2020 was characterized by soaring crude oil import bills exceeding $120 Billion USD, deteriorating air quality in metropolitan centers, and government policy initiatives to achieve net-zero carbon targets. The central government introduced the FAME-II subsidy scheme and Production Linked Incentives (PLI) to aggressively spur domestic electric vehicle adoption.
Industry Analysis (I): The domestic passenger car sector was historically mature, growing at 5-7% annually. However, the Electric Vehicle sub-industry was entering the explosive Rapid Expansion Stage, with EV sales compounding at over 70% CAGR. Applying Porter's 5 Forces: initial entry barriers were formidable due to specialized battery chemistry and software engineering requirements, insulating early movers from rapid fragmentation.
Company Analysis (C): Tata Motors recognized this top-down inflection point early. Utilizing group synergies (Tata Power for charging infrastructure, Tata AutoComp for battery packs), Tata Motors captured over 70% of the domestic passenger EV market with models like the Nexon EV. Investors who applied the top-down EIC framework in 2020 reaped over 500% capital appreciation as Tata Motors transitioned from a debt-laden legacy automaker into an electric mobility powerhouse.
7. AKTU University Exam Practice Drill
Master these model academic responses curated specifically for AKTU MBA end-semester examinations in Investment and Portfolio Management (BMB FM 01).
Section A: Short Answer Conceptual Questions (2 Marks Each)
Q1. What is the fundamental premise of the EIC framework?
Model Answer: The fundamental premise of the EIC (Economy-Industry-Company) framework is that an individual security's future earnings performance is deeply anchored in its broader environment. Corporate performance is first governed by macroeconomic health (Economy), filtered through industry-level growth structures and competitive forces (Industry), and finally determined by firm-specific operational and competitive advantages (Company).
Q2. Differentiate between Cyclical and Defensive Industries with examples.
Model Answer: Cyclical industries produce capital goods or discretionary products whose revenues and profits swing heavily in tandem with national GDP expansions and recessions (e.g., Automobile, Steel, Construction). Defensive industries produce non-discretionary necessities with highly inelastic consumer demand, ensuring stable earnings and dividends even during economic downturns (e.g., Pharmaceuticals, FMCG staples).
Q3. Why is the Rapid Expansion stage considered ideal for growth investors?
Model Answer: The Rapid Expansion stage is ideal for growth investors because product demand has proven market acceptance, embryonic technical risks are eliminated, market shakeouts have removed weak competitors, and dominant surviving firms enjoy high sales growth rates and expanding profit margins that outpace broad GDP growth.
Section B & C: Comprehensive Analytical Questions (10 Marks Each)
Q4. Describe the top-down fundamental analysis approach using the EIC framework. How do macroeconomic indicators influence stock market performance?
Model Answer Structure & Complete Analytical Presentation:
The top-down fundamental approach evaluates investments through a disciplined three-tiered analytical hierarchy:
1. Macroeconomic Analysis (The 'E' Dimension): The analyst evaluates overall macroeconomic health because aggregate economic output establishes the revenue boundary for listed enterprises. Six core indicators dominate this stage:
- Real GDP Growth: Expands aggregate consumption and industrial utilization; rising GDP boosts corporate revenues.
- Inflation Rates (CPI/WPI): Moderate inflation enables pricing power; hyperinflation drives input cost inflation and compresses gross margins.
- Monetary Policy & Interest Rates: Central bank rate hikes elevate corporate debt-servicing burdens and raise the discount rate (( k_e )) used in equity valuation models, lowering justified stock prices.
- Fiscal Deficits: Large fiscal deficits cause government debt crowding-out and push up long-term sovereign bond yields.
- Foreign Exchange Rates: Currency depreciation benefits net exporters (IT, Pharma) while severely hurting import-dependent sectors (Refineries, Capital Goods).
- Current Account & FPI Inflows: Surplus foreign exchange reserves stabilize financial markets and prevent sudden capital flight.
2. Industry Analysis (The 'I' Dimension): The analyst filters through industrial sectors to identify industries with favorable structural economics, applying the Industry Life Cycle model (Pioneering -> Growth -> Maturity -> Decline) and Michael Porter's Five Forces to isolate sectors with high barriers to entry, low buyer power, and resilient pricing power.
3. Company Analysis (The 'C' Dimension): Finally, within the shortlisted high-growth sectors, the analyst selects outstanding individual firms with durable economic moats, ethical corporate governance, high Return on Invested Capital (ROIC), and attractive valuation multiples relative to intrinsic value.
Q5. Explain Michael Porter's Five Forces model of industry competitive analysis. Apply this framework to assess the attractiveness of an industrial sector of your choice.
Model Answer Structure & Complete Content:
Michael Porter's Five Forces framework assesses the competitive intensity, profit pools, and structural attractiveness of an industry through five fundamental forces:
1. Threat of New Entrants: When new competitors can easily enter an industry, capacity expands and profit margins are driven down to normal levels. High entry barriers—such as massive capital investment requirements, regulatory licensing, proprietary patents, and economies of scale—insulate incumbent firms (e.g., Telecom infrastructure, Commercial Aircraft manufacturing).
2. Bargaining Power of Buyers: When buyers are concentrated or purchase in huge volumes, they exert strong downward pressure on prices and demand expensive customizations. Conversely, when buyers are fragmented retail consumers, pricing power remains with the seller.
3. Bargaining Power of Suppliers: When critical raw materials or technology inputs are controlled by a handful of monopolistic suppliers with high switching costs, suppliers extract the lion's share of industry profits by raising prices.
4. Threat of Substitute Products: The existence of viable substitute products caps the prices that incumbents can charge. High price-performance substitutes erode industry margins over time (e.g., OTT streaming substituting traditional cable television).
5. Intensity of Rivalry Among Incumbents: High fixed operating costs, exit barriers, and slow market growth force existing players into destructive price wars that destroy shareholder value.
Application to the Indian Telecom Sector: The Indian telecom market features exceptionally high entry barriers (spectrum auction costs, massive 5G fiber capex), which reduced competition from 12+ players in 2012 down to a 3-player oligopoly (Jio, Airtel, Vi). While buyer switching costs are low (Mobile Number Portability), oligopolistic market consolidation has enabled recent recurring tariff hikes, structurally expanding Average Revenue Per User (ARPU) and industry return on capital.
Discussion & Questions
0 CommentsAcademic insights, questions, and conceptual clarifications from students & faculty.
No questions or comments yet
Have a doubt about this topic, an exam tip, or a conceptual perspective? Start the discussion below!
Leave a Comment / Ask a Question
Your email address will not be published. Required fields are marked *