
HRIS Data Sources, Cleaning & Metric Taxonomy: ETL Pipelines, Missing Data Imputation, GIGO Elimination, and Metric Dictionaries
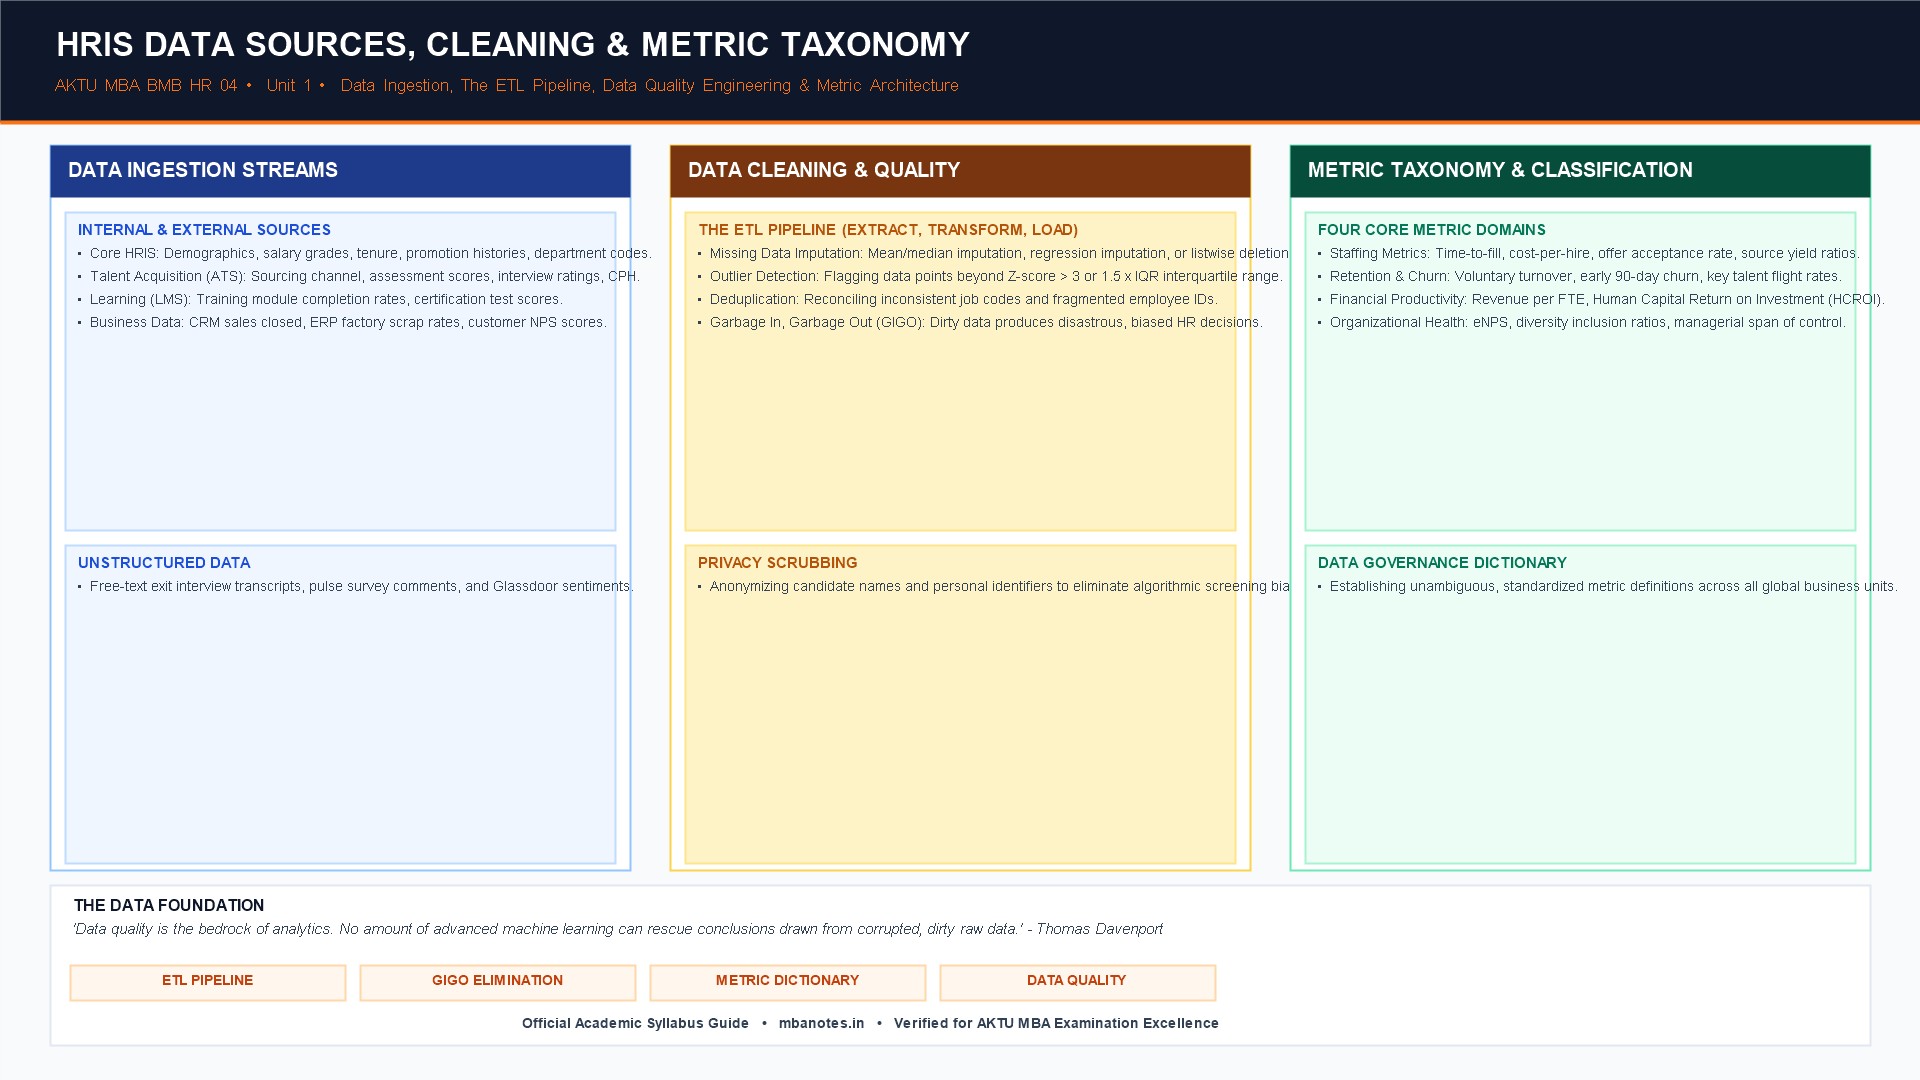
Figure 1.3: Data Engineering in HR – Ingestion Streams, The ETL Pipeline, Outlier Cleaning, and Four Metric Domains.
1. Enterprise HR Data Sources: Internal & External Ingestion
A comprehensive people analytics engine must aggregate data across diverse transactional and behavioral systems:
| System Stream | Specific Data Attributes Ingested | Primary Analytical Application |
|---|---|---|
| 1. Core HRIS | Employee ID, Date of Joining, Job Code, Grade Band, Salary, Manager ID, Demographics. | Baseline demographic profiling, compensation modeling, and tenure analysis. |
| 2. Applicant Tracking (ATS) | Application source (LinkedIn, Referral), Screening scores, Interview ratings, Offer acceptance, CPH. | Recruitment funnel yield ratios, channel cost-efficiency, and quality-of-hire analysis. |
| 3. Learning Management (LMS) | Course completions, assessment test marks, hours logged, certifications acquired. | Skill gap analysis and Jack Phillips Level 5 Training ROI modeling. |
| 4. Performance & Talent | Goal achievement ratings, 360-degree feedback scores, 9-box talent grid placements, PIP logs. | Predicting leadership potential and promotion decision analytics. |
| 5. Enterprise Business Systems | CRM sales volume, customer satisfaction (CSAT), ERP defect scrap rates, code commit velocity. | Establishing empirical linkages between employee training/engagement and real revenue creation. |
2. The HR ETL Pipeline & Data Warehousing Architecture
Raw HR data is notoriously fragmented across incompatible legacy systems. The ETL Pipeline (Extract, Transform, Load) resolves this fragmentation:
- Extract: Ingesting raw transactional logs from Core HR, ATS, LMS, and biometric databases via automated scheduled API connectors or batch flat-file dumps.
- Transform: The core data-wrangling phase:
- Standardizing data formats (converting disparate date formats like
DD/MM/YYYYvsMM-DD-YYYY). - Reconciling fragmented job titles (e.g., merging “Sr. Dev”, “Senior Developer”, and “Software Engineer III” into a standardized job code
TECH-04). - Applying mathematical imputations to eliminate missing values.
- Standardizing data formats (converting disparate date formats like
- Load: Depositing the clean, normalized data into a secure, centralized enterprise Data Warehouse or cloud data lake for query execution.
3. Mathematical Data Cleaning & GIGO Elimination
The universal computer science axiom “Garbage In, Garbage Out” (GIGO) is especially dangerous in HR. If a machine learning algorithm is trained on dirty data containing duplicate records or biased scoring, it will generate flawed promotion recommendations and discriminatory screening decisions.
1. Missing Data Imputation Strategies
- Listwise (Complete-Case) Deletion: Dropping any record that contains missing fields. Only acceptable if missingness is completely random (MCAR) and affects < 3% of the dataset; otherwise, it introduces severe sample truncation bias.
- Mean / Median Imputation: Replacing missing numeric values with the mean (for normal distributions) or median (for skewed distributions like salaries).
- Predictive Regression Imputation: Using statistical regression to estimate the missing value based on known correlated variables (e.g., predicting an unrecorded salary based on tenure, education, and grade band).
2. Outlier Remediation
- Z-Score Method: Any data point with a standardized Z-score exceeding $pm 3.0$ is flagged as an outlier:
Standardized Z-Score = (Observed Value - Mean) / Standard Deviation
Identifies data outliers lying beyond ±3 standard deviations from the population mean.
- Interquartile Range (IQR) Method: Outliers lie below $Q_1 – 1.5 imes ext{IQR}$ or above $Q_3 + 1.5 imes ext{IQR}$. Handled via Winsorization (capping extreme values at the 99th percentile) rather than deletion.
4. The Comprehensive HR Metric Taxonomy
Clean data is organized into four standardized functional metric clusters:
| Metric Domain | Core Standard Metrics | Primary Business Objective |
|---|---|---|
| 1. Staffing & Talent Acquisition | Time-to-Fill (TTF), Cost-per-Hire (CPH), Source Yield Ratios, Offer Acceptance Rate (OAR), Quality of Hire. | Measuring recruiting efficiency, candidate pipeline quality, and hiring channel cost optimization. |
| 2. Churn, Retention & Mobility | Annual Turnover Rate (%), Voluntary vs Involuntary Churn, 90-Day Early Attrition, Promotion Velocity. | Detecting organizational flight risks, toxic managerial sub-cultures, and key talent drain. |
| 3. Productivity & Financial Impact | Revenue per Employee (FTE), Profit per FTE, Human Capital Value Added (HCVA), Human Capital ROI (HCROI). | Demonstrating workforce efficiency and human capital contribution to the corporate balance sheet. |
| 4. Organizational Health & Culture | Employee Net Promoter Score (eNPS), Absenteeism Rate, Gender Diversity Ratios, Training Hours per FTE. | Measuring workplace culture, employee psychological engagement, and ESG compliance. |
6. Data Cleaning Diagnostic Matrix: Anomalies & Mathematical Fixes
| Data Quality Anomaly | Manifestation in HRIS | Mathematical / Engineering Solution |
|---|---|---|
| Missing Salary Values | Blank fields in compensation records for 5% of employees. | Apply Median Imputation grouped by Job Band and Department to preserve distribution integrity. |
| Typographical Salary Outlier | A monthly salary entered as ₹50,00,000 instead of ₹50,000 due to keypunch error. | Flag via Z-Score ($Z > 3.0$); verify against employment contract and execute data correction. |
| Inconsistent Job Titles | “Dev”, “Software Eng”, “Java Developer” for the same role. | Text normalization using fuzzy string matching and mapping to master Job Code dictionary. |
| Duplicate Employee Records | Re-hired alumni having two separate employee IDs in the database. | Deduplication using unique permanent tax identifiers (PAN / Aadhaar) as primary key. |
7. AKTU Exam Focus: Short Notes & Solved Model Questions
Section A: 2-Mark High-Frequency Core Concepts
Q1: What does the acronym ETL stand for in data engineering?
Answer: Extract, Transform, and Load—the automated pipeline that extracts raw data from multiple sources, standardizes and cleans it, and loads it into a centralized data warehouse.
Q2: What is the meaning of GIGO in analytics?
Answer: “Garbage In, Garbage Out”—the axiom stating that flawed, incomplete, or corrupted input data will inevitably produce invalid, dangerous analytical conclusions regardless of algorithm sophistication.
Q3: How is an outlier identified using the Z-score method?
Answer: A data point is classified as an outlier if its Z-score is greater than $+3$ or less than $-3$, indicating it lies more than 3 standard deviations away from the dataset mean.
Q4: Why is median imputation preferred over mean imputation for salary data?
Answer: Salary distributions are heavily right-skewed by a few high-earning executives; the median represents the true middle value without being distorted by extreme outliers.
Q5: Name two metrics classified under the ‘Staffing & Talent Acquisition’ taxonomy domain.
Answer: (1) Time-to-Fill (TTF), and (2) Cost-per-Hire (CPH).
Section B/C: 10-Mark Detailed Exam Questions
Q6: Detailed explanation: Discuss the various internal and external data sources that feed an enterprise HRIS. Explain the architecture and phases of the ETL pipeline in preparing workforce data for advanced analytics.
Structured Model Answer:
- Enterprise Ingestion Streams: Detail Core HRIS, ATS recruitment logs, LMS learning records, Performance/Talent evaluations, and external CRM/ERP business systems.
- The ETL Architecture:
- Extract: API connectors and batch flat-file ingestion.
- Transform: Normalization, date standardization, job title deduplication, and data quality scrubbing.
- Load: Warehousing in relational data marts and enterprise data lakes.
- Data Governance: Explain how ETL pipelines ensure compliance with data privacy mandates (GDPR/DPDP) and prevent GIGO failures.
Q7: Examine the mathematical and statistical methodologies utilized for data cleaning in HR analytics. Detail the protocols for handling missing data and outliers, and outline the four domains of the HR Metric Taxonomy.
Structured Model Answer:
- Missing Data Imputation: Detail listwise deletion (risks of truncation bias), mean/median imputation, and predictive regression imputation.
- Outlier Remediation: Explain the Z-score formula ($Z = (X – mu)/sigma$) with the $pm 3.0$ threshold and the Interquartile Range (IQR) method with Winsorization.
- HR Metric Taxonomy: Detail the 4 core domains (Staffing, Churn, Productivity, and Organizational Health) with specific KPI formulas as presented in Section 4.
Discussion & Questions
0 CommentsAcademic insights, questions, and conceptual clarifications from students & faculty.
No questions or comments yet
Have a doubt about this topic, an exam tip, or a conceptual perspective? Start the discussion below!
Leave a Comment / Ask a Question
Your email address will not be published. Required fields are marked *