
Facility Location & Plant Layout: Location Models, Facility Layout Types & Assembly Line Balancing
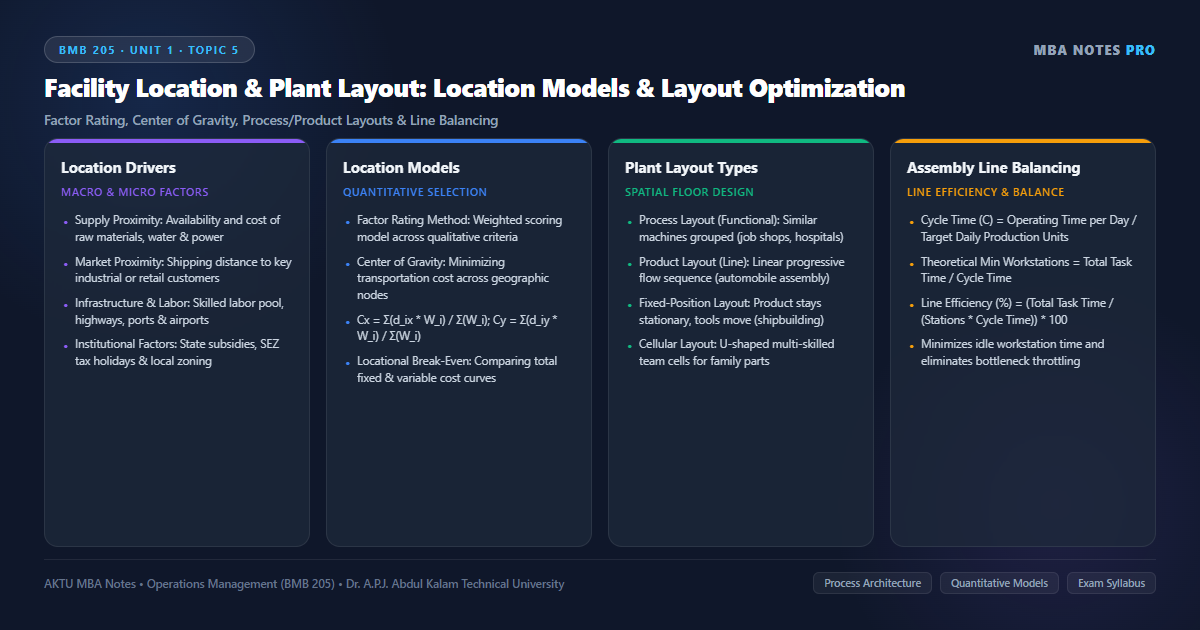
1. Facility Location Decisions: Determinants & The Strategic Geographic Framework
Facility Location Planning is the strategic process of selecting the geographic site for an organization’s physical operations (manufacturing plants, central distribution warehouses, or regional service centers). Because building a modern industrial facility involves hundreds of crores in irreversible capital expenditure, poor location choices permanently handicap an enterprise with inflated freight costs, labor shortages, and uncompetitive delivery lead times.
Comprehensive Taxonomy of Location Determinants:
- 1. Proximity to Raw Materials (Supply-Oriented Location): Critical when raw materials are weight-losing (gross) or perishable during processing (e.g., sugar mills located in sugarcane fields, iron and steel plants located near coal and iron-ore mines like Jamshedpur).
- 2. Proximity to Markets (Market-Oriented Location): Critical when the finished product is weight-gaining, fragile, bulky, or highly perishable (e.g., commercial bakeries, soft-drink bottling plants, glass manufacturing, ready-mix concrete).
- 3. Availability & Quality of Labor: Availability of skilled machinists, engineers, local wage rate structures, and historical labor union stability (e.g., IT hubs in Bengaluru and Pune due to premier engineering college density).
- 4. Utilities & Physical Infrastructure: Guaranteed 24/7 high-voltage industrial electrical power grid, high-volume industrial water supply, effluent disposal channels, and proximity to National Highway corridors, freight railways, and container shipping ports.
- 5. Government Incentives & Institutional Policies: Special Economic Zone (SEZ) corporate tax holidays, capital investment subsidies, land acquisition ease, and favorable state industrial policies (e.g., Gujarat’s Sanand auto hub and Tamil Nadu’s Sriperumbudur electronics corridor).
- 6. Environmental & Community Factors: Local zoning laws, industrial air pollution emission standards, climate extremes, and community acceptance.
2. Quantitative Facility Location Models: Factor Rating & Center of Gravity
Operations analysts utilize structured quantitative models to evaluate and select the optimal site among competing geographic candidates:
Where \(W_i\) = Weight assigned to factor \(i\) (such that \(\sum W_i = 1.0\)), and \(S_{ij}\) = Score assigned to candidate site \(j\) on factor \(i\) (typically on a 1–100 scale). The candidate location with the highest total weighted score is selected.
Where \((C_x, C_y)\) = Optimal coordinates for the central distribution facility; \((d_{ix}, d_{iy})\) = Cartesian coordinates of destination/origin city \(i\); and \(W_i\) = Volume of freight / cargo weight transported to/from city \(i\).
Problem: SafeLogistics India wishes to establish a centralized regional warehouse to supply four major industrial cities in Uttar Pradesh. The grid coordinates and monthly shipping volumes (in truckloads) are as follows:
• Noida: Coordinates \((10, 20)\), Monthly Volume = 500 truckloads.
• Kanpur: Coordinates \((40, 50)\), Monthly Volume = 800 truckloads.
• Lucknow: Coordinates \((50, 60)\), Monthly Volume = 600 truckloads.
• Varanasi: Coordinates \((80, 40)\), Monthly Volume = 400 truckloads.
Calculate the optimal coordinates \((C_x, C_y)\) for the central warehouse using the Center of Gravity method.
\(\sum W_i = 500 + 800 + 600 + 400 = \mathbf{2,300 \text{ truckloads}}\).
Step 2: Calculate Weighted X-Coordinates (\(\sum [d_{ix} \cdot W_i]\)):
\(\text{Noida: } 10 \times 500 = 5,000\)
\(\text{Kanpur: } 40 \times 800 = 32,000\)
\(\text{Lucknow: } 50 \times 600 = 30,000\)
\(\text{Varanasi: } 80 \times 400 = 32,000\)
\(\sum (d_{ix} \cdot W_i) = 5,000 + 32,000 + 30,000 + 32,000 = \mathbf{99,000}\).
\(C_x = \frac{99,000}{2,300} = \mathbf{43.04}\).
Step 3: Calculate Weighted Y-Coordinates (\(\sum [d_{iy} \cdot W_i]\)):
\(\text{Noida: } 20 \times 500 = 10,000\)
\(\text{Kanpur: } 50 \times 800 = 40,000\)
\(\text{Lucknow: } 60 \times 600 = 36,000\)
\(\text{Varanasi: } 40 \times 400 = 16,000\)
\(\sum (d_{iy} \cdot W_i) = 10,000 + 40,000 + 36,000 + 16,000 = \mathbf{1,02,000}\).
\(C_y = \frac{1,02,000}{2,300} = \mathbf{44.35}\).
Optimal Warehouse Location: Grid coordinates \(\mathbf{(43.04, 44.35)}\) (placing the facility just north-east of Kanpur along the Lucknow highway corridor to minimize total transport ton-kilometers).
3. Plant Layout Archetypes: Process, Product, Fixed-Position & Cellular Layouts
Once the facility location is established, operations managers must design the internal Plant Layout — the physical configuration of departments, workstations, storage areas, and material handling pathways within the facility walls.
| Layout Type | Structural Arrangement | Major Advantages | Major Limitations | Typical Application |
|---|---|---|---|---|
| Process (Functional) Layout | Equipment performing similar operations are grouped into dedicated departments (all lathes in Lathe Dept, all welding in Welding Dept). | High flexibility for diverse product specs; machine breakdown in one section does not halt other operations; lower capital investment in general machines. | Long, chaotic material travel paths; very high work-in-process (WIP) inventory clutter; complex scheduling and production tracking. | Custom job shops, auto repair garages, machine tool fabrication, general hospitals. |
| Product (Line) Layout | Workstations and equipment are arranged in a strict linear sequence matching the progressive assembly flow of a specific product. | Rapid throughput time; minimum material handling; low WIP inventory; simplified visual control and low unit cost via economies of scale. | Zero product variety flexibility; a breakdown at any single workstation immediately halts the entire production line; high dedicated capital cost. | Automobile mass assembly (Maruti Suzuki), consumer appliance lines, television manufacturing. |
| Fixed-Position Layout | The product remains completely stationary in a central location due to its immense size or weight, while workers, materials, and machinery move to it. | Eliminates the impossible logistical challenge of moving massive heavy structures; highly flexible for one-of-a-kind engineering projects. | Congestion around the workpiece; high site storage costs; duplicate tools required for different subcontracting crews. | Shipbuilding (Cochin Shipyard), commercial aircraft construction, nuclear power plant construction. |
| Cellular (Group Technology) Layout | Dissimilar machines required to fabricate a specific part family are organized into compact U-shaped self-contained work cells. | Combines the flexibility of a process layout with the low unit cost and speed of a product layout; slashes setup times; fosters team ownership. | Requires sophisticated group technology coding; machine duplication across multiple cells may reduce overall machine utilization. | Precision automotive component manufacturing, machining families, electronic PCB assembly. |
4. Assembly Line Balancing: Cycle Time, Theoretical Minimum Stations & Line Efficiency
In a Product (Assembly Line) Layout, the central operational engineering challenge is Assembly Line Balancing — the technique of assigning individual work elements to sequential workstations such that the idle time across all stations is minimized while meeting the required market output rate.
Where \(\sum t_i\) = Sum of all elemental task times, and \(\lceil \cdot \rceil\) denotes rounding up to the next whole integer.
Where \(N_a\) = Actual number of workstations utilized in the balanced line design.
Problem: An electrical ceiling fan assembly line operates 8 hours per day (480 minutes). The management requires a target production rate of 160 fans per day. The total sum of all elemental task times required to assemble one fan is 12.0 minutes. After applying heuristic balancing rules (Longest Work Element), the industrial engineer successfully groups the tasks into 5 actual workstations. Calculate: (a) Desired Cycle Time, (b) Theoretical Minimum Workstations, (c) Assembly Line Efficiency, and (d) Balance Delay percentage.
\(C = \frac{\text{Operating Time per Day}}{\text{Target Output}} = \frac{480 \text{ minutes}}{160 \text{ fans}} = \mathbf{3.0 \text{ minutes/fan}}\).
Operating Meaning: A finished fan must roll off the final workstation every 3.0 minutes.
Step 2: Compute Theoretical Minimum Workstations (\(N_{min}\)):
\(N_{min} = \frac{\sum t_i}{C} = \frac{12.0 \text{ minutes}}{3.0 \text{ minutes}} = \mathbf{4.0 \rightarrow 4 \text{ workstations}}\).
Step 3: Compute Line Efficiency with 5 Actual Workstations (\(N_a = 5\)):
\(\text{Line Efficiency } (E) = \left( \frac{\sum t_i}{N_a \times C} \right) \times 100\% = \left( \frac{12.0}{5 \times 3.0} \right) \times 100\% = \left( \frac{12.0}{15.0} \right) \times 100\% = \mathbf{80.0\%}\).
Step 4: Compute Balance Delay (\(d\)):
\(\text{Balance Delay } (d) = 100\% – 80.0\% = \mathbf{20.0\%}\).
Managerial Interpretation: 80% of total operator time on the assembly line is actively productive, while 20% is idle balance delay due to indivisible task precedence constraints.
Corporate Case Vignette: Tata Motors’ Strategic Plant Relocation to Sanand & Cellular Assembly
The establishment of Tata Motors’ passenger vehicle plant in Sanand, Gujarat, represents the most celebrated facility location and plant layout case study in Indian corporate history:
- The Location Crisis & Relocation: In October 2008, severe political land agitation forced Tata Motors to abandon its nearly completed Nano factory in Singur, West Bengal. Tata Motors executed a historic relocation to Sanand, Gujarat, completing plant construction in an astonishing 14 months.
- Strategic Location Selection Drivers: Sanand provided ideal location attributes: (1) Immediate access to 1,100 acres of flat, non-disputed industrial land, (2) Proximity to Mundra and Kandla deep-water international ports for export shipping, (3) Direct connectivity to the Delhi-Mumbai Industrial Corridor (DMIC), and (4) Proactive single-window state governmental approvals.
- Integrated Layout & Supplier Park: Tata Motors laid out an adjacent 350-acre Tier-1 vendor park directly connected via internal conveyor tunnels, allowing instrument panels, seats, and exhaust systems to flow straight to line-side workstations.
- Measurable Impact: The Sanand manufacturing complex catalyzed Gujarat into one of India’s preeminent automotive clusters (subsequently attracting Ford, MG Motor, and Suzuki) and now serves as Tata Motors’ primary electric vehicle (EV) manufacturing hub producing the Nexon EV and Tiago EV.
Managerial Takeaway: Facility location is a strategic commitment that can either strangle an enterprise with political friction or catapult it into global logistics leadership through port connectivity and state-level policy alignment.
AKTU University Examination Questions: Plant Location & Plant Layout
Section A (2 Marks Conceptual Questions):
Q1: What is Cycle Time in assembly line balancing? Give its formula. (2 Marks)
Q2: Distinguish between Process Layout and Product Layout. (2 Marks)
Section B / C (10 Marks Detailed Analytical Question):
Q: Discuss the factors influencing Plant Location decisions. Explain the Center of Gravity method with a suitable mathematical example. Compare Process, Product, Fixed-Position, and Cellular layouts. An assembly line with operating time of 480 minutes/day needs to produce 120 units. Total task time is 15 minutes. Find Cycle Time, Theoretical Minimum Workstations, and Line Efficiency if 5 stations are actually utilized. (10 Marks)
1. Plant Location Determinants: Detail Primary Factors (Raw materials, Market proximity, Labor availability, Power/Water) and Secondary Factors (SEZ tax holidays, Port/Highway connectivity, Zoning laws).
2. Center of Gravity Method: Explain freight logistics optimization; present Cartesian coordinate formulas \(C_x = \sum(d_{ix} \cdot W_i) / \sum W_i\) and \(C_y = \sum(d_{iy} \cdot W_i) / \sum W_i\) with a 4-city illustration.
3. Comparative Layout Matrix: Construct comprehensive 5-point table comparing Process, Product, Fixed-Position, and Cellular layouts across layout geometry, flexibility, WIP inventory, material travel paths, and capital costs.
4. Complete Line Balancing Solution:
• \(\text{Cycle Time (C)} = \frac{480 \text{ minutes}}{120 \text{ units}} = \mathbf{4.0 \text{ minutes/unit}}\).
• \(N_{min} = \frac{\sum t_i}{C} = \frac{15.0}{4.0} = 3.75 \rightarrow \mathbf{4 \text{ workstations}}\).
• \(\text{Line Efficiency } (E) = \left( \frac{15.0}{5 \times 4.0} \right) \times 100\% = \left( \frac{15.0}{20.0} \right) \times 100\% = \mathbf{75.0\%}\).
• \(\text{Balance Delay } (d) = 100\% – 75.0\% = \mathbf{25.0\%}\).
5. Corporate Case Reference: Cite Tata Motors’ historic relocation from Singur to Sanand, Gujarat.
Discussion & Questions
0 CommentsAcademic insights, questions, and conceptual clarifications from students & faculty.
No questions or comments yet
Have a doubt about this topic, an exam tip, or a conceptual perspective? Start the discussion below!
Leave a Comment / Ask a Question
Your email address will not be published. Required fields are marked *