
Data Reduction Strategies: Dimensionality Reduction, Principal Component Analysis (PCA), and Numerosity Reduction
1. The Curse of Dimensionality in Modern Enterprise Data
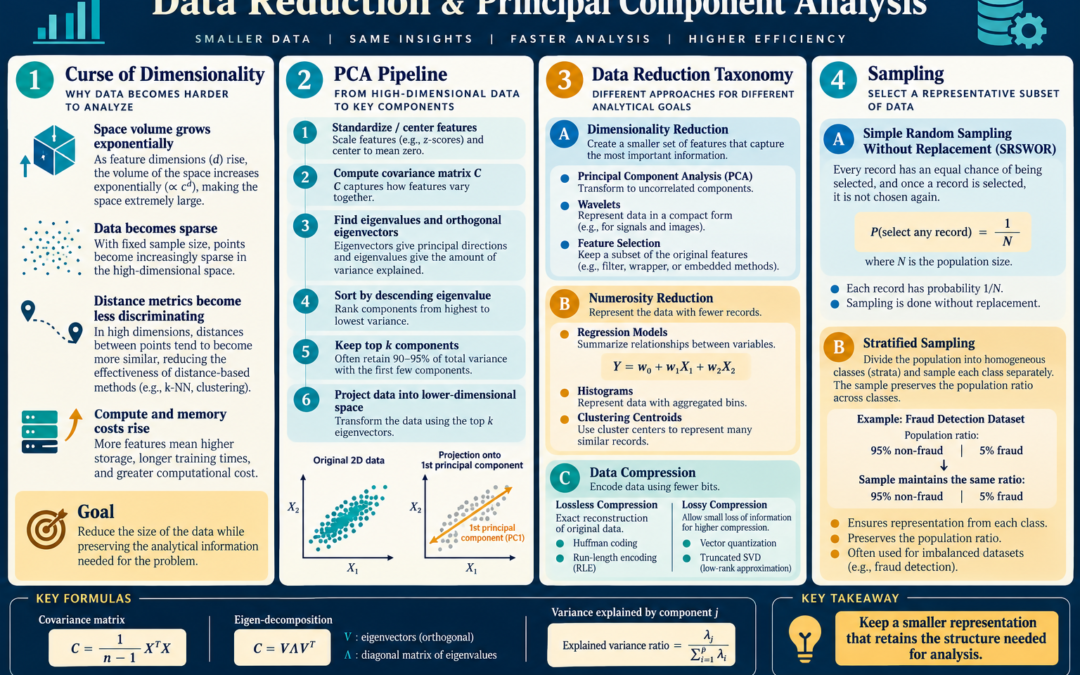
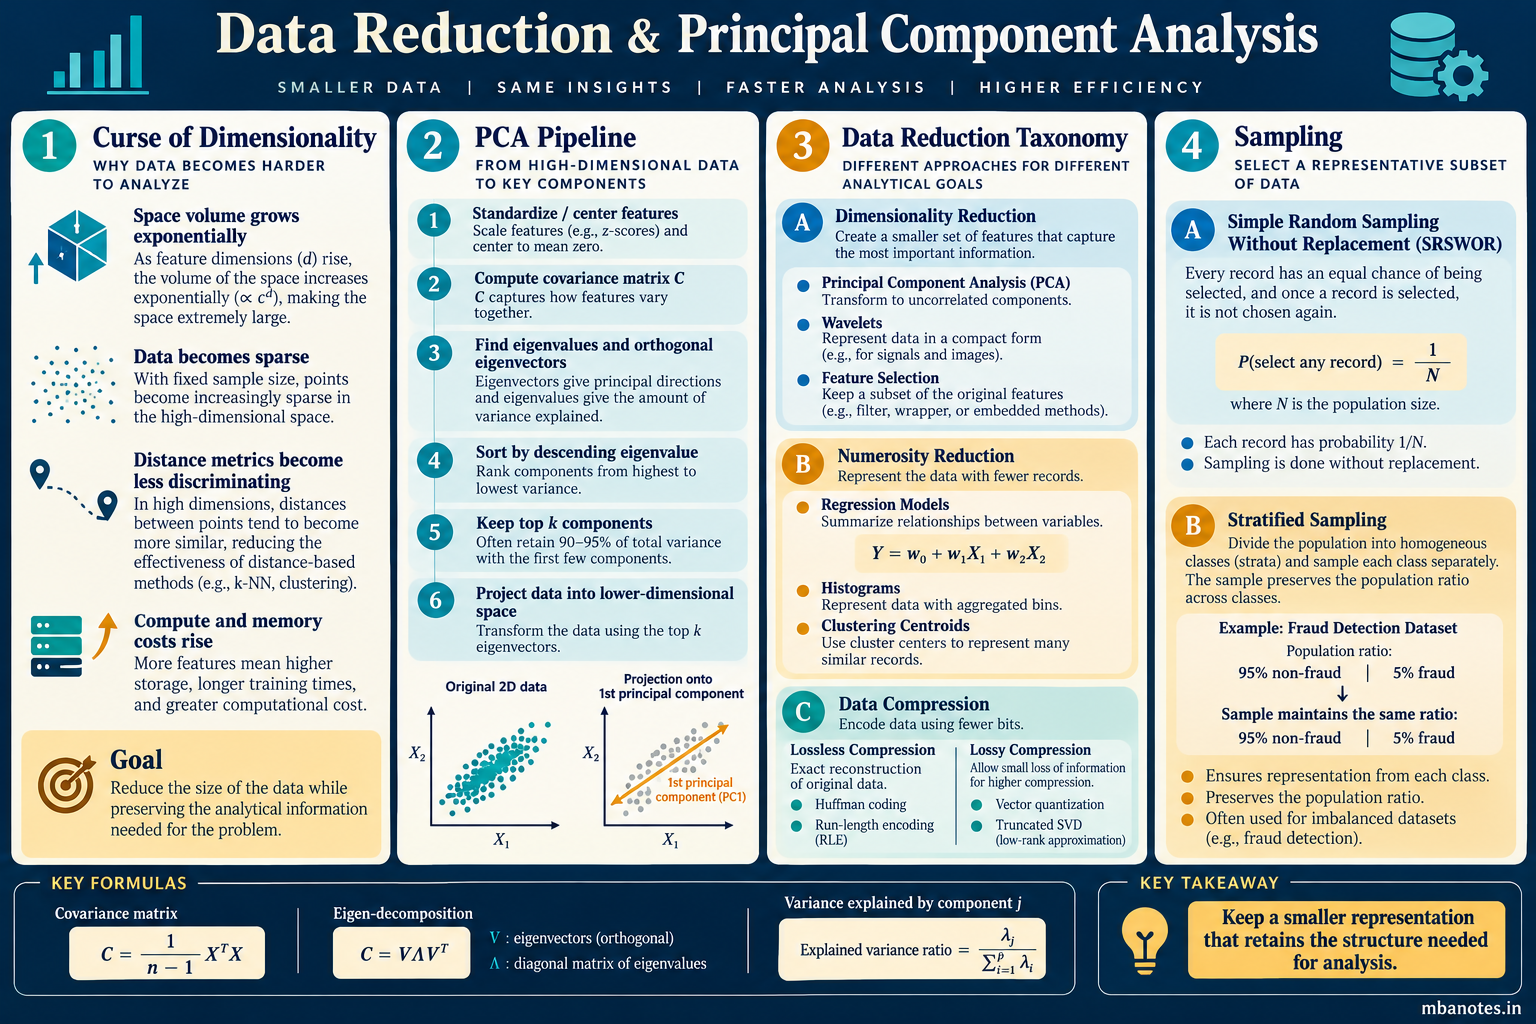
When datasets contain hundreds or thousands of attributes (dimensions)—as commonly encountered in genomic research, text mining, and high-frequency trading—mining algorithms encounter the Curse of Dimensionality. As dimensionality increases:
- The volume of space grows exponentially, causing data points to become extremely sparse.
- Euclidean distance metrics collapse: the distance between the closest pair of points becomes indistinguishable from the distance between the furthest pair.
- Computational complexity and memory consumption explode, causing algorithms to become intractable.
Data Reduction techniques obtain a reduced representation of the dataset that is much smaller in volume yet closely maintains the integrity of the original data, producing identical (or near-identical) analytical results.
2. Taxonomy of Data Reduction Strategies
Data reduction methodologies fall into three primary strategic categories:
| Reduction Strategy | Operational Objective | Core Algorithmic Techniques |
|---|---|---|
| Dimensionality Reduction | Reduces the number of random attributes under consideration by projecting to lower dimensions | Principal Component Analysis (PCA), Discrete Wavelet Transforms (DWT), Feature Subset Selection |
| Numerosity Reduction | Replaces raw data records with smaller alternative data representations | Parametric (Linear/Log-linear Regression), Non-parametric (Histograms, Clustering, Sampling) |
| Data Compression | Applies mathematical encoding transformations to reduce physical storage footprint | Lossless (Huffman, Run-Length Encoding), Lossy (Vector Quantization, Truncated SVD) |
3. Principal Component Analysis (PCA): Mathematical Foundations
Principal Component Analysis (PCA) is the premier unsupervised linear dimensionality reduction technique. It searches for (k) orthogonal (n)-dimensional vectors (where (k le n)) that best capture the variance in the data:
- Step 1 (Centering): Normalize input data so that each attribute has a mean of zero and standard deviation of one.
- Step 2 (Covariance Matrix): Compute the (n imes n) Covariance Matrix (C) to measure pairwise attribute variance and covariance.
- Step 3 (Eigen Decomposition): Compute the eigenvalues ((lambda_1, lambda_2, dots, lambda_n)) and corresponding orthogonal eigenvectors ((e_1, e_2, dots, e_n)) of matrix (C).
- Step 4 (Sorting & Selection): Sort eigenvectors in descending order of their eigenvalues. The eigenvector with the largest eigenvalue is the First Principal Component ((PC_1)), capturing the maximum variance in the data. (PC_2) captures the second-highest variance while remaining strictly orthogonal (uncorrelated) to (PC_1).
- Step 5 (Projection): Retain the top (k) principal components that together capture 90%–95% of total variance, discarding remaining components. Project the original data points onto this new (k)-dimensional subspace.
4. Numerosity Reduction: Parametric versus Non-Parametric
Numerosity reduction shrinks the number of tuples:
- Parametric Models: Fit the data to mathematical models (such as Multiple Linear Regression: (Y = w_0 + w_1 X_1 + w_2 X_2)). Once parameters (w) are estimated, only the equation parameters need to be stored, discarding raw data tuples entirely.
- Non-Parametric Histograms: Partition continuous values into buckets, storing only bucket counts and boundary ranges.
- Clustering as Reduction: Replace thousands of raw records with the coordinates of the cluster centroids.
5. Sampling Methodologies in Data Mining
Sampling enables mining algorithms to execute on representative subsets rather than millions of records:
- Simple Random Sample Without Replacement (SRSWOR): Each tuple has an equal probability of selection ((1/N)); once selected, it cannot be chosen again.
- Stratified Sampling: If the dataset is partitioned into mutually exclusive demographic or class strata (e.g., 95% non-fraud, 5% fraud), stratified sampling draws samples from each stratum independently, preserving the minority class ratio in the training sample.
University Examination Question Bank & Model Solutions
Designed as per Dr. A.P.J. Abdul Kalam Technical University (AKTU) MBA Examination Pattern.
Part A: Conceptual 2-Mark Short Answer Questions
Q1 [2 Marks]: Define the primary objective of Data Reduction & PCA in data preprocessing.
Ans: It represents a vital computational data preparation paradigm designed to clean dirty raw records, scale features mathematically, reduce dimensionality, or visually explore underlying distributions prior to data mining.
Q2 [2 Marks]: What is the significance of Curse of Dimensionality in data mining pipelines?
Ans: It establishes the formal statistical mechanisms—such as missing value imputation, min-max linear scaling, PCA variance projection, or Tukey five-number summaries—that guarantee algorithmic integrity and prevent model bias.
Part B & C: Analytical 10-Mark Detailed Solutions & Technical Frameworks
Question 1
Model Examination Answer Blueprint:
Strategic Executive Summary: 11. Data Reduction & PCA
- Preemptive Data Cleansing: Resolving missing values and smoothing noise to prevent the "Garbage In, Garbage Out" collapse of machine learning models.
- Feature Standardization: Applying Min-Max and Z-Score normalization to prevent attributes with large scales from dominating distance-based mining models.
- Dimensionality Optimization: Deploying PCA to defeat the Curse of Dimensionality while capturing 95% of total variance in a compact subspace.
- Visual Anomaly Detection: Utilizing Tukey five-number summaries and Box Plot IQR fences (1.5*IQR) to detect and isolate extreme financial and operational outliers.
Frequently Asked Questions (Academic & Technical FAQ)
Q1. What makes Data Reduction & PCA critical for modern enterprise managers?
It ensures that executive decision models and predictive AI are trained on clean, unbiased, mathematically standardized data, preventing costly operational errors.
Q2. How do practitioners apply these principles in corporate environments?
Data scientists construct automated preprocessing pipelines that impute missing values via class-median/KNN, scale features via Z-score, compress features via PCA, and visually audit distributions using box plots and heatmaps.
Q3. What are the most frequent examination questions asked from this topic in AKTU?
AKTU examinations frequently require explaining methods for handling missing data, detailing binning smoothing methods, solving numerical problems on Min-Max and Z-Score normalization, detailing PCA steps, and constructing Box Plots with IQR outlier detection.
Discussion & Questions
0 CommentsAcademic insights, questions, and conceptual clarifications from students & faculty.
No questions or comments yet
Have a doubt about this topic, an exam tip, or a conceptual perspective? Start the discussion below!
Leave a Comment / Ask a Question
Your email address will not be published. Required fields are marked *