
Data Cleaning and Data Integration Techniques: Handling Missing Values, Noise Smoothing, and Redundancy Detection
1. The Imperative of Data Preprocessing
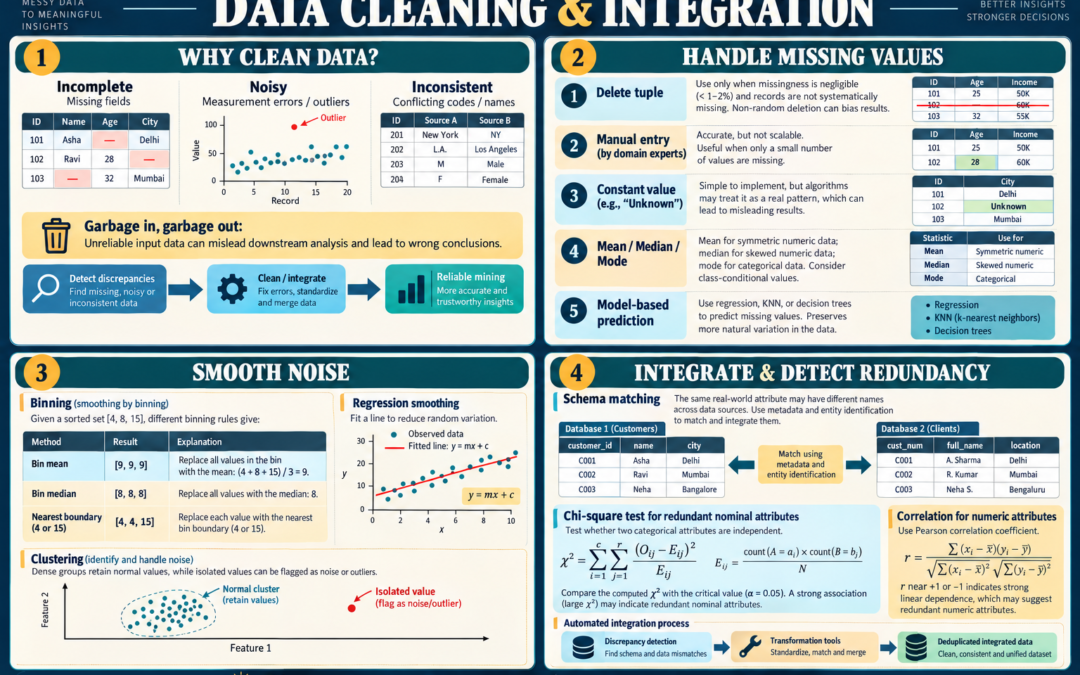
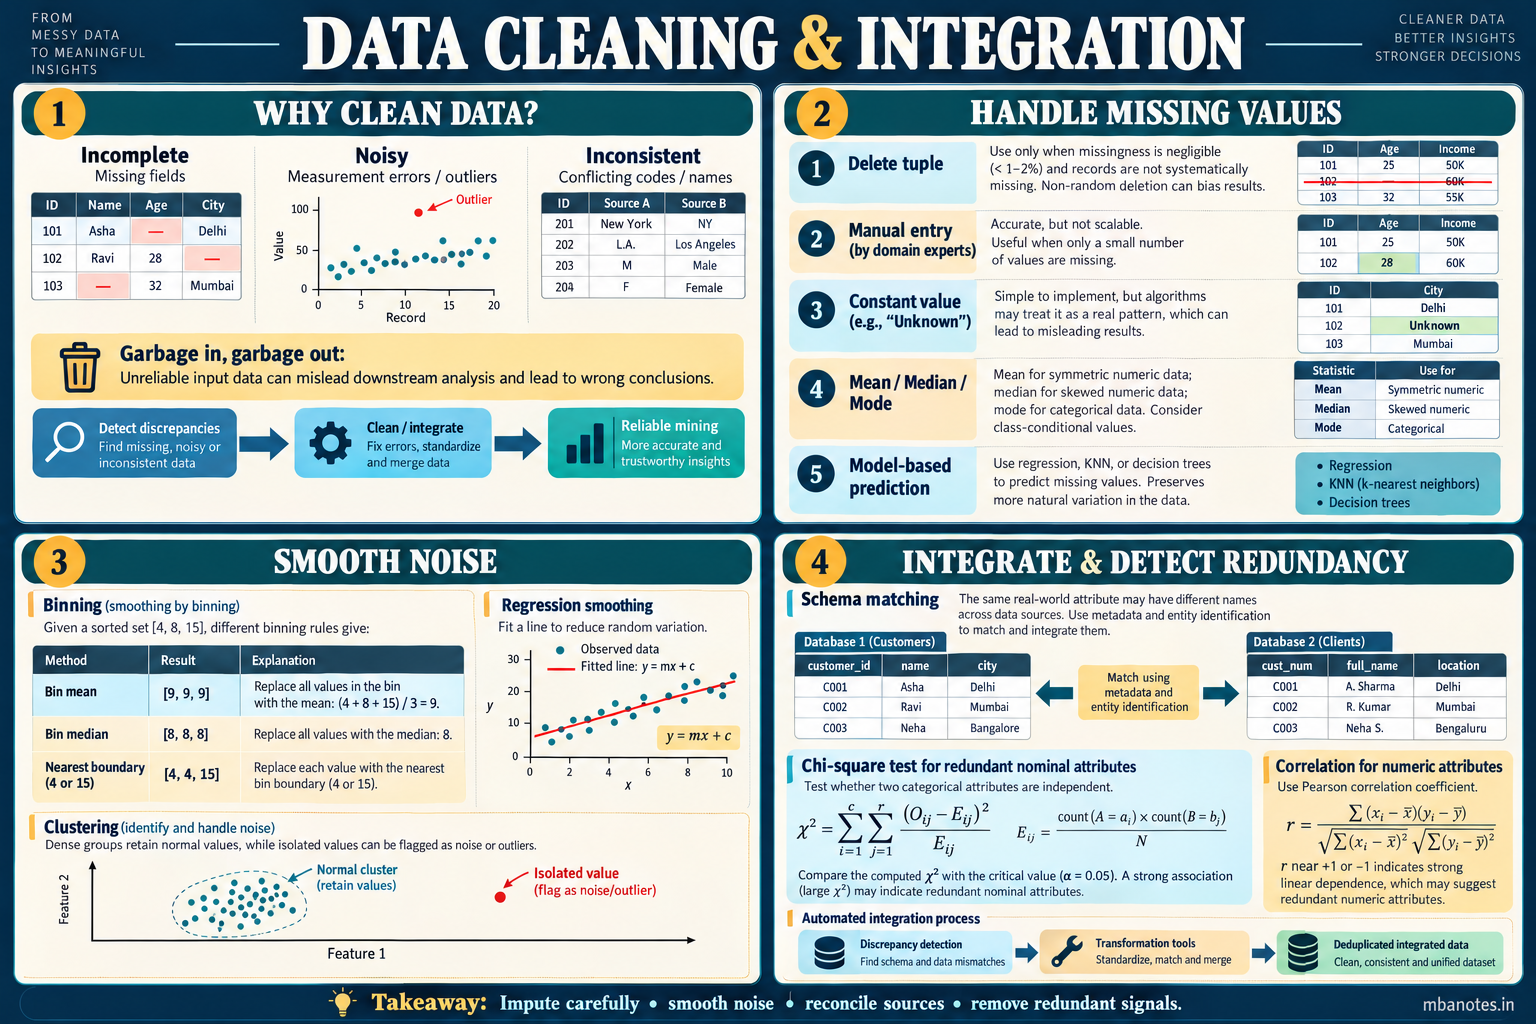
Real-world enterprise databases are notoriously dirty: they are incomplete (lacking attribute values or containing only aggregate data), noisy (containing errors, sensor faults, or extreme outliers), and inconsistent (containing conflicting codes or discrepancies in naming conventions). The foundational maxim of machine learning and data warehousing is "Garbage In, Garbage Out" (GIGO). If the input data is tainted, the most sophisticated mining algorithms will yield invalid, misleading, or destructive business decisions. Data preprocessing—encompassing cleaning, integration, transformation, and reduction—is the critical prerequisite for reliable analytical intelligence.
2. Methodologies for Handling Missing Values
Missing values occur frequently due to malfunctioning equipment, survey non-response, misunderstanding during data entry, or changes in business requirements. Data scientists evaluate five primary strategies for missing value treatment:
- 1. Ignore the Tuple (Listwise Deletion): Discards any record that contains a missing value for the target or critical attributes. Feasible only when the dataset is massive and the percentage of missing records is negligible (<1–2%). If missingness is non-random, listwise deletion introduces severe sampling bias.
- 2. Manual Imputation: Domain experts inspect each missing record and manually enter values. Highly accurate, but completely unfeasible for corporate datasets containing millions of transactions.
- 3. Global Constant Imputation: Replaces all missing values with a uniform constant (such as "Unknown", "N/A", or a sentinel value like -999). Simple to implement, but mining algorithms may mistakenly interpret the constant as a genuine predictive pattern.
- 4. Central Tendency Imputation (Mean / Median / Mode):
- Symmetric Data: Uses the overall attribute Mean for numerical attributes following normal Gaussian distributions.
- Skewed Data: Uses the attribute Median for skewed continuous data (such as income or housing prices) to prevent outlier distortion.
- Categorical Data: Uses the attribute Mode (most frequent value) for discrete nominal variables.
- Class-Conditional Imputation: Calculates the mean/median/mode exclusively among samples belonging to the same class label (e.g., imputing missing salary by averaging salaries of employees with the identical job title).
- 5. Model-Based Imputation (Most Probable Value): Uses predictive algorithms—such as linear regression, K-Nearest Neighbors (KNN), or decision tree induction—to predict and fill the missing attribute value based on the values of all other present attributes. Delivers superior statistical accuracy while preserving natural data variances.
3. Smoothing Noisy Data: Binning, Regression & Clustering
Noise is a random error or variance in a measured variable. Noisy continuous attributes are smoothed using three foundational techniques:
| Smoothing Technique | Operational Mechanism | Concrete Illustrative Example |
|---|---|---|
| Binning by Bin Means | Sort data; partition into equal-frequency bins; replace each value in a bin with the arithmetic mean of that bin. | Sorted: [4, 8, 15] → Mean = 9 → Smoothed: [9, 9, 9] |
| Binning by Bin Medians | Sort data; partition into bins; replace each value with the median value of that bin. | Sorted: [4, 8, 15] → Median = 8 → Smoothed: [8, 8, 8] |
| Binning by Bin Boundaries | Identify minimum and maximum boundary values in each bin; replace each value with its closest boundary. | Sorted: [4, 8, 15] → Min=4, Max=15 → 8 is closer to 4 → Smoothed: [4, 4, 15] |
| Regression Smoothing | Fit the noisy data points to a linear mathematical function: y = mx + c. The fitted line replaces noisy raw points. | Removes random fluctuations from sales trend records. |
| Clustering Smoothing | Group similar values into dense clusters. Values falling outside cluster boundaries are flagged as noise/outliers. | Detects fraudulent credit card transaction spikes. |
4. Data Integration & Redundancy Detection (Chi-Square Test)
Data integration combines data from multiple heterogeneous databases into a unified coherent store. Two primary challenges must be resolved:
- Schema Integration & Entity Identification: Matching real-world entities across disparate sources (e.g., determining whether
customer_idin DB1 refers to the identical entity ascust_numin DB2). Handled via metadata catalogs and data dictionaries. - Redundancy Detection: Redundant attributes occur when an attribute can be derived from another (e.g., storing both Date_of_Birth and Age). Redundant nominal attributes are detected via the Chi-Square ((chi^2)) Test of Independence:$$\boxed{(chi^2 = sum_{i=1}^{c} sum_{j=1}^{r} rac{(O_{ij} - E_{ij})^2}{E_{ij}}) where (E_{ij} = rac{ ext{count}(A=a_i) imes ext{count}(B=b_j)}{N})}$$If the computed (chi^2) statistic exceeds the critical threshold at a given significance level ((alpha = 0.05)), the two attributes are correlated/redundant, and one should be removed.
- Correlation Coefficient for Numeric Data: Redundant continuous attributes are identified using the Pearson Correlation Coefficient ((r)): values approaching +1 or -1 indicate strong linear dependence.
5. Data Cleaning Pipeline Architecture
Modern enterprise pipelines automate data cleansing via a two-step cycle: Discrepancy Detection (using metadata constraints, statistical profiling, and rule-based regex parsers to catch anomalies) followed by Data Transformation Tools (ETL engines, data wrangling tools like Trifacta, and automated record-linkage deduplication algorithms).
University Examination Question Bank & Model Solutions
Designed as per Dr. A.P.J. Abdul Kalam Technical University (AKTU) MBA Examination Pattern.
Part A: Conceptual 2-Mark Short Answer Questions
Q1 [2 Marks]: Define the primary objective of Data Cleaning & Integration in data preprocessing.
Ans: It represents a vital computational data preparation paradigm designed to clean dirty raw records, scale features mathematically, reduce dimensionality, or visually explore underlying distributions prior to data mining.
Q2 [2 Marks]: What is the significance of Missing Data Imputation in data mining pipelines?
Ans: It establishes the formal statistical mechanisms—such as missing value imputation, min-max linear scaling, PCA variance projection, or Tukey five-number summaries—that guarantee algorithmic integrity and prevent model bias.
Part B & C: Analytical 10-Mark Detailed Solutions & Technical Frameworks
Question 1
Model Examination Answer Blueprint:
Strategic Executive Summary: 9. Data Cleaning & Integration
- Preemptive Data Cleansing: Resolving missing values and smoothing noise to prevent the "Garbage In, Garbage Out" collapse of machine learning models.
- Feature Standardization: Applying Min-Max and Z-Score normalization to prevent attributes with large scales from dominating distance-based mining models.
- Dimensionality Optimization: Deploying PCA to defeat the Curse of Dimensionality while capturing 95% of total variance in a compact subspace.
- Visual Anomaly Detection: Utilizing Tukey five-number summaries and Box Plot IQR fences (1.5*IQR) to detect and isolate extreme financial and operational outliers.
Frequently Asked Questions (Academic & Technical FAQ)
Q1. What makes Data Cleaning & Integration critical for modern enterprise managers?
It ensures that executive decision models and predictive AI are trained on clean, unbiased, mathematically standardized data, preventing costly operational errors.
Q2. How do practitioners apply these principles in corporate environments?
Data scientists construct automated preprocessing pipelines that impute missing values via class-median/KNN, scale features via Z-score, compress features via PCA, and visually audit distributions using box plots and heatmaps.
Q3. What are the most frequent examination questions asked from this topic in AKTU?
AKTU examinations frequently require explaining methods for handling missing data, detailing binning smoothing methods, solving numerical problems on Min-Max and Z-Score normalization, detailing PCA steps, and constructing Box Plots with IQR outlier detection.
Discussion & Questions
0 CommentsAcademic insights, questions, and conceptual clarifications from students & faculty.
No questions or comments yet
Have a doubt about this topic, an exam tip, or a conceptual perspective? Start the discussion below!
Leave a Comment / Ask a Question
Your email address will not be published. Required fields are marked *