
Critical Path Method (CPM) and Project Evaluation & Review Technique (PERT)
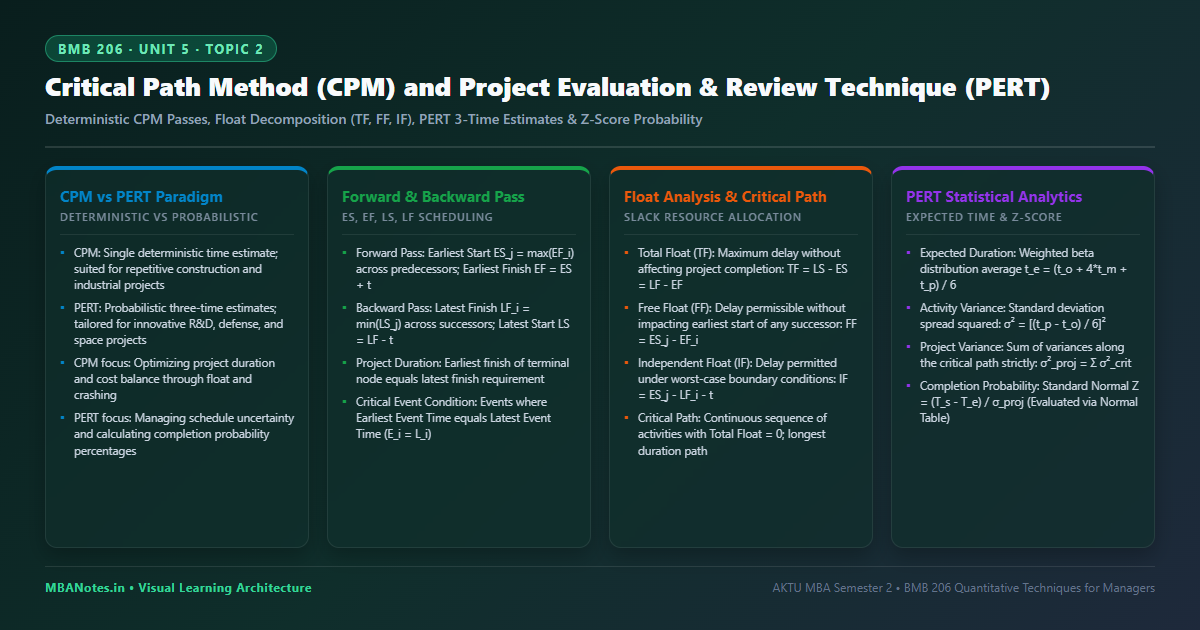
1. Conceptual Paradigm: CPM vs. PERT Comparison
Although both CPM (Critical Path Method) and PERT (Project Evaluation and Review Technique) share the common objective of managing complex projects through network representations, they were developed independently to solve radically different managerial challenges.
- Origins: CPM was developed in 1957 by DuPont and Remington Rand for chemical plant maintenance turnarounds; PERT was created in 1958 by the US Navy Special Projects Office and Booz Allen Hamilton for the Polaris missile program.
- Time Orientation: CPM is strictly deterministic, relying on a single well-known historical duration per task; PERT is probabilistic, utilizing three separate estimates to accommodate high uncertainty.
- Orientation: CPM is an activity-oriented system focusing on task schedules and cost optimization; PERT is an event-oriented system focusing on key milestone achievements.
- Cost Crashing Integration: CPM provides direct mechanisms to trade off time and cost through activity crashing; standard PERT primarily controls temporal probability rather than financial slope optimization.
- Appropriate Application Domains: CPM is ideal for repetitive civil engineering, construction, and plant overhaul projects; PERT is indispensable for cutting-edge R&D, space exploration, and software innovation.
2. CPM Computational Mechanics: Forward, Backward Pass & Floats
The determination of critical project paths and operational slacks involves two algorithmic traverses of the network diagram:
- Forward Pass (Earliest Time Determination):
- Set Earliest Start of project source event $ES_1 = 0$.
- Earliest Finish: $EF_{ij} = ES_i + t_{ij}$.
- Earliest Start of successor event $j$: $ES_j = max_{{i}} (EF_{ij})$ across all incoming predecessor paths.
- Project Makespan equals the earliest completion time of the terminal event ($T = EF_{\text{end}}$).
- Backward Pass (Latest Time Determination):
- Set Latest Finish of project terminal sink event equal to its Earliest Finish: $LF_{\text{end}} = EF_{\text{end}}$.
- Latest Start: $LS_{ij} = LF_j - t_{ij}$.
- Latest Finish of predecessor event $i$: $LF_i = min_{{j}} (LS_{ij})$ across all outgoing successor paths.
- Classification of Floats (Activity Slack):
- Total Float ($TF$): The maximum duration an activity can be delayed without delaying the final project completion date: $$TF_{ij} = LS_{ij} - ES_i = LF_j - EF_{ij}$$
- Free Float ($FF$): The portion of total float by which an activity can be delayed without delaying the earliest start time of any immediate successor activity: $$FF_{ij} = ES_j - EF_{ij} = TF_{ij} - S_j \quad (\text{where } S_j = LF_j - ES_j)$$
- Independent Float ($IF$): The duration an activity can be delayed without affecting the schedule of either predecessors or successors, assuming predecessors finish at their latest dates and successors start at their earliest: $$IF_{ij} = max(0, ES_j - LF_i - t_{ij}) = FF_{ij} - S_i$$
- The Critical Path: The sequence of unbroken critical activities that connects the initial event to the terminal event for which Total Float is strictly zero ($TF = 0$). It represents the longest temporal path through the network and dictates minimum total project duration.
PERT Statistical Formulation & Solved Step-by-Step Numerical
Probability AnalysisPERT Three-Time Equations (Beta Distribution)
Activity Variance: $\sigma^2 = \left(\frac{t_p - t_o}{6}\right)^2$
Activity Standard Deviation: $\sigma = \frac{t_p - t_o}{6}$
Expected Project Makespan: $T_e = \sum_{i in \text{Critical Path}} t_{ei}$
Project Standard Deviation: $\sigma_{\text{proj}} = \sqrt{\sum_{i in \text{Critical Path}} \sigma_i^2}$
Standard Normal Variate: $Z = \frac{T_s - T_e}{\sigma_{\text{proj}}}$
A high-tech manufacturing project consists of 6 activities. The time estimates (in weeks) are provided below:
• Find the expected duration ($t_e$) and variance ($\sigma^2$) for each activity.
• Conduct forward and backward passes, determine the Critical Path, and state project duration ($T_e$).
• Calculate Total Float and Free Float for all activities.
• Calculate the probability that the project completes within $T_s = 22\text{ weeks}$.
| Activity | Nodes ($i - j$) | $t_o$ (Optimistic) | $t_m$ (Most Likely) | $t_p$ (Pessimistic) | Expected $t_e$ | Variance $\sigma^2$ |
|---|---|---|---|---|---|---|
| $A$ | $1 - 2$ | 2 | 5 | 8 | 5 | $[(8-2)/6]^2 = 1.00$ |
| $B$ | $1 - 3$ | 3 | 6 | 9 | 6 | $[(9-3)/6]^2 = 1.00$ |
| $C$ | $2 - 4$ | 4 | 7 | 16 | 8 | $[(16-4)/6]^2 = 4.00$ |
| $D$ | $3 - 4$ | 2 | 5 | 8 | 5 | $[(8-2)/6]^2 = 1.00$ |
| $E$ | $2 - 5$ | 2 | 8 | 14 | 8 | $[(14-2)/6]^2 = 4.00$ |
| $F$ | $4 - 5$ | 4 | 7 | 10 | 7 | $[(10-4)/6]^2 = 1.00$ |
Forward and Backward Pass Float Calculations:
| Activity | Duration ($t_e$) | $ES$ | $EF$ | $LS$ | $LF$ | Total Float ($TF$) | Free Float ($FF$) | Critical? |
|---|---|---|---|---|---|---|---|---|
| $A$ (1-2) | 5 | 0 | 5 | 0 | 5 | 0 | 0 | YES (Critical) |
| $B$ (1-3) | 6 | 0 | 6 | 2 | 8 | 2 | 2 | No |
| $C$ (2-4) | 8 | 5 | 13 | 5 | 13 | 0 | 0 | YES (Critical) |
| $D$ (3-4) | 5 | 6 | 11 | 8 | 13 | 2 | 2 | No |
| $E$ (2-5) | 8 | 5 | 13 | 12 | 20 | 7 | 7 | No |
| $F$ (4-5) | 7 | 13 | 20 | 13 | 20 | 0 | 0 | YES (Critical) |
Critical Path & Probability of Completion ($T_s = 22\text{ weeks}$):
The activities with zero total float form the path: $1 \to 2 \to 4 \to 5$ ($A \to C \to F$).
Expected Project Makespan: $T_e = t_e(A) + t_e(C) + t_e(F) = 5 + 8 + 7 = \mathbf{20\text{ weeks}}$.
2. Project Variance and Standard Deviation:
Sum variances strictly along the critical path:
$$\sigma_{\text{proj}}^2 = \sigma_A^2 + \sigma_C^2 + \sigma_F^2 = 1.00 + 4.00 + 1.00 = \mathbf{6.00\text{ weeks}^2}$$ $$\sigma_{\text{proj}} = \sqrt{6.00} \approx \mathbf{2.449\text{ weeks}}$$
3. Z-Score Calculation for Target $T_s = 22\text{ weeks}$:
$$Z = \frac{T_s - T_e}{\sigma_{\text{proj}}} = \frac{22 - 20}{2.449} = \frac{2.00}{2.449} = +\mathbf{0.816} \approx \mathbf{0.82}$$
4. Cumulative Probability Lookup:
From standard normal distribution cumulative tables:
$$P(Z \le 0.82) = 0.5000 + 0.2939 = \mathbf{0.7939} \quad (\mathbf{79.39\%})$$
Executive Conclusion: The company has a $79.39\%$ probability of completing the high-tech project within the target deadline of 22 weeks. There is a $20.61\%$ risk of project overrun.
3. Comparative Analysis: Float Relationships
Float represents operational buffer or scheduling flexibility available to project managers. The mathematical hierarchy among floats is universal:
| Float Measure | Analytical Formula | Managerial Freedom | Impact on Successor Tasks | Mathematical Inequality |
|---|---|---|---|---|
| Total Float ($TF$) | $LS - ES = LF - EF$ | Shared resource; belongs to the entire path | Consuming TF reduces float available for downstream tasks | $TF \ge FF \ge IF$ |
| Free Float ($FF$) | $ES_j - EF_i$ | Local resource; belongs solely to activity $(i, j)$ | Consuming FF has ZERO negative impact on any successor task | $FF \le TF$ |
| Independent Float ($IF$) | $max(0, ES_j - LF_i - t)$ | Autonomous buffer under worst possible scheduling boundaries | Zero impact on predecessors or successors under all circumstances | $IF \le FF$ (May be 0) |
5. Corporate Case Vignette: Aerospace Defense Project (ISRO)
Indian Space Research Organisation (ISRO): Chandrayaan Launch Window Alignment
In lunar landing missions, orbital mechanics dictates strict astronomical launch windows separated by months. For Chandrayaan, thousands of subsystems—ranging from cryogenic upper stage propulsion (CE-20), lander thruster calibration, and deep-space telemetry to tracking dish synchronization—had to be ready for launch within a 48-hour launch window.
ISRO mission planners deployed PERT three-time beta modeling across all development streams. Subsystem variance calculations revealed that the critical path passed through lander hazard detection sensor integration rather than the cryogenic engine test. Resources were reallocated from non-critical solar array fabrication (which had 18 days of Free Float) to sensor qualification, lowering project variance from $\sigma^2 = 14.8\text{ days}^2$ to $5.2\text{ days}^2$. This raised the probability of hitting the celestial launch window from $62\%$ to $98.4\%$, culminating in a historic flawless soft landing.
6. AKTU University Examination Question Bank
Q1: Differentiate between Total Float and Free Float.
Model Answer: Total Float ($TF = LS - ES = LF - EF$) is the total time an activity can be delayed without delaying the completion of the entire project; consuming it may delay downstream tasks. Free Float ($FF = ES_j - EF_i$) is the delay permissible without impacting the earliest start time of any succeeding activity.
Q2: Write the formulas for expected duration ($t_e$) and variance ($\sigma^2$) in PERT analysis.
Model Answer: In PERT analysis, expected duration is $t_e = \frac{t_o + 4t_m + t_p}{6}$ and variance is $\sigma^2 = \left(\frac{t_p - t_o}{6}\right)^2$, where $t_o$ is optimistic time, $t_m$ is most likely time, and $t_p$ is pessimistic time.
Q3: Compare CPM and PERT in detail. A project has activities A through G with estimated times $(t_o, t_m, t_p)$. Construct the network, find the critical path, compute total project variance, and evaluate the probability of completing 2 days before the scheduled due date.
Exam Strategy: Present a clear comparative table (deterministic vs probabilistic, activity vs event). Calculate $t_e$ and $\sigma^2$ for all activities. Tabulate $ES, EF, LS, LF, TF$. Trace zero float path. Sum critical path variances. Calculate $Z = (T_s - T_e)/\sigma_{\text{proj}}$ and look up cumulative normal probability.
Discussion & Questions
0 CommentsAcademic insights, questions, and conceptual clarifications from students & faculty.
No questions or comments yet
Have a doubt about this topic, an exam tip, or a conceptual perspective? Start the discussion below!
Leave a Comment / Ask a Question
Your email address will not be published. Required fields are marked *