
Customer Lifetime Value (CLV): Estimation Models, Retention Dynamics and Strategic Customer Equity Management
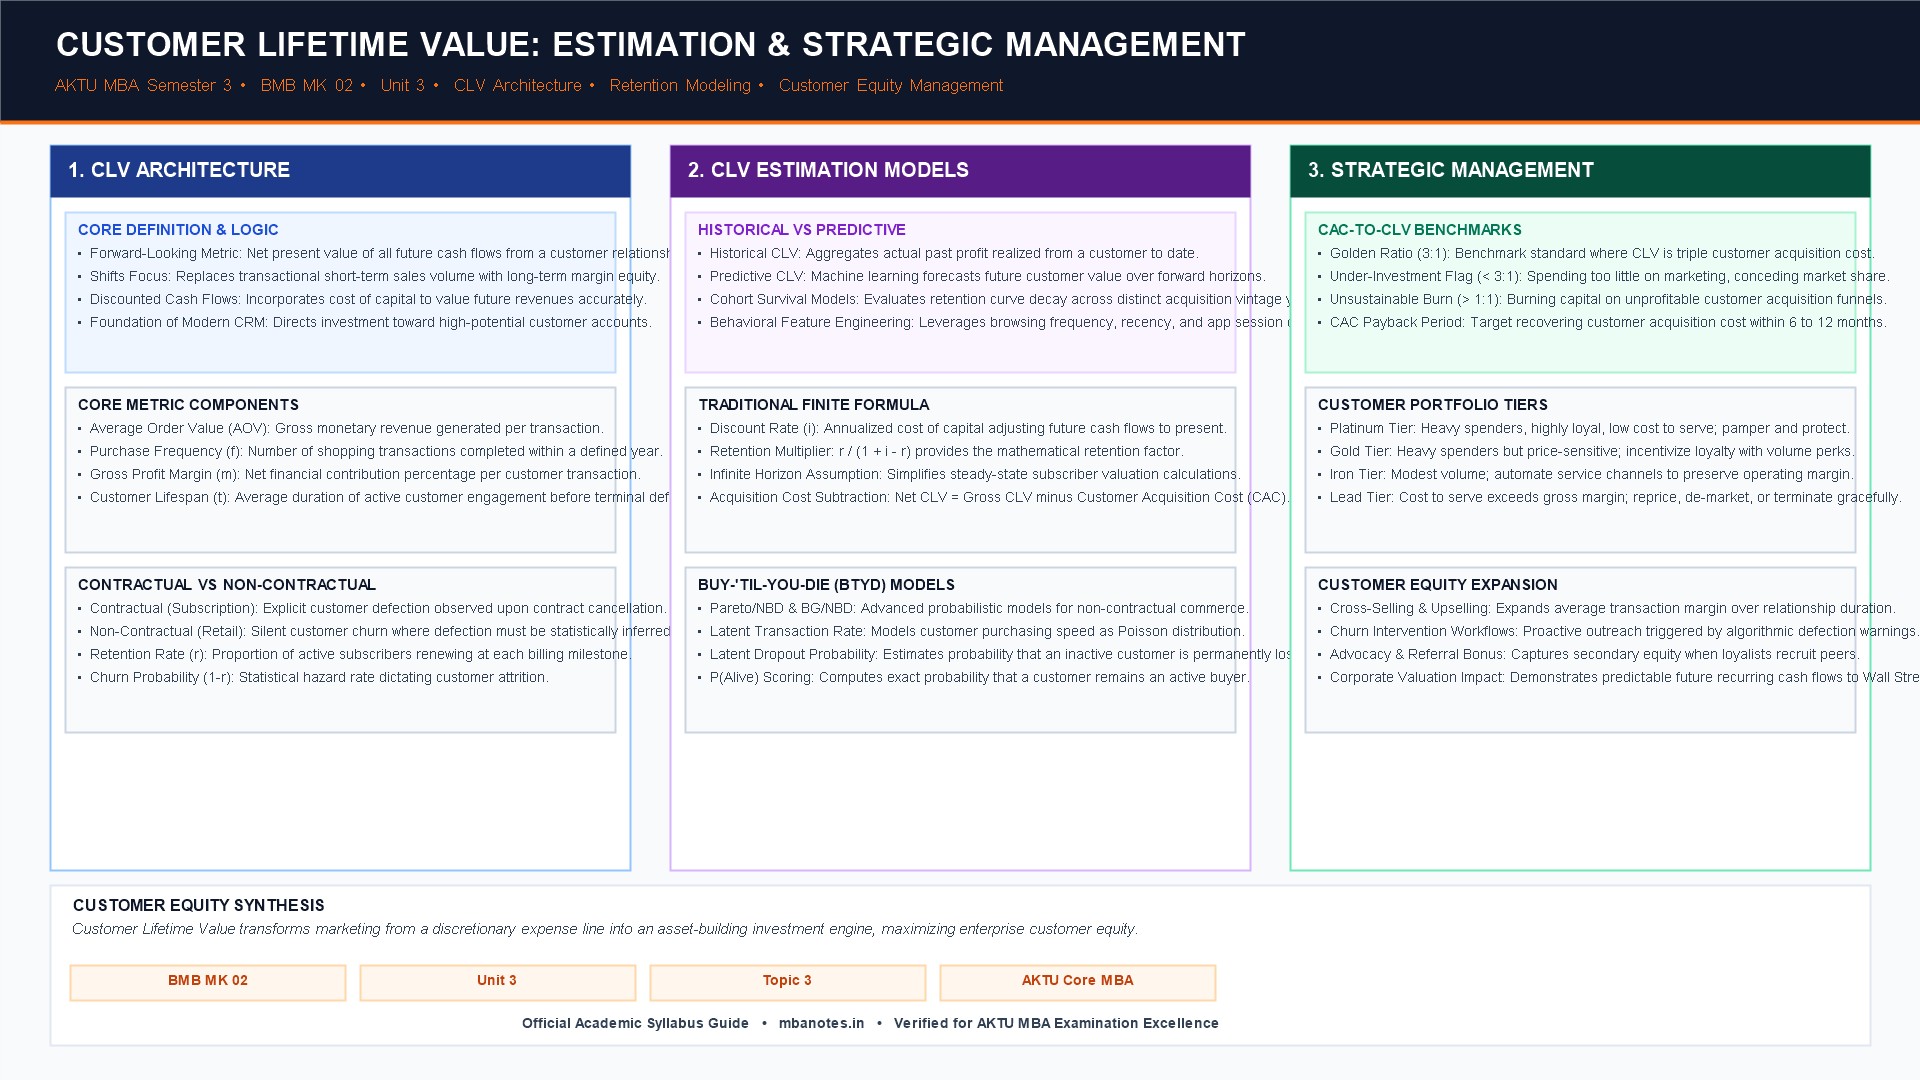
1. Conceptual Foundations and Financial Logic of Customer Lifetime Value
Customer Lifetime Value (CLV, or LTV) represents one of the most transformative concepts in modern commercial marketing analytics. Rooted in discounted cash flow (DCF) corporate finance, CLV is defined as the present financial value of the future net operating margins attributable to a customer throughout the entire duration of their relationship with the firm. Historically, marketing departments were evaluated purely on short-term sales volume, leading to wasteful promotional discounting that attracted low-loyalty bargain hunters who churned immediately. CLV fundamentally corrects this myopic bias, transforming marketing from an ephemeral operating expense into an enterprise asset-building investment engine.
The conceptual foundations and core financial building blocks of CLV include:
- Forward-Looking Orientation: Unlike historical accounting summaries that record past expenditures, CLV is inherently forward-looking, forecasting how much profit a newly acquired customer cohort will generate over the next 3, 5, or 10 years.
- Average Order Value (AOV): The gross currency amount spent by a customer per shopping transaction.
- Purchase Frequency: The average number of distinct buying events completed by a customer within an annual operating cycle.
- Contribution Gross Margin: The net profit percentage remaining after deducting all direct variable costs of goods sold (COGS) and fulfillment from gross revenues.
- Customer Retention Rate: The percentage of active customers who continue to transact or renew their subscription contracts over successive billing periods.
- Discount Rate (Cost of Capital): The annual corporate weighted average cost of capital (WACC) utilized to discount future cash flows back to present rupee value.
- Customer Acquisition Cost (CAC) Subtraction: Net CLV reflects the net present value of all operating profits minus the upfront marketing and sales expenditure incurred to acquire the customer in the first place.
2. Mathematical Estimation Frameworks: Finite Horizon, Multipliers and BTYD Models
The mathematical estimation of CLV varies significantly depending on whether the business operates within a contractual (subscription-based) or non-contractual (retail transactional) commercial setting.
- Contractual vs Non-Contractual Settings: In contractual settings (SaaS platforms, telecom providers, fitness gyms), customer defection is observed explicitly when a user terminates their contract. In non-contractual settings (supermarkets, e-commerce, fashion retail), customers churn silently without notifying the firm, requiring probabilistic inference to distinguish an active dormant shopper from a permanently defected customer.
- The Simplified Infinite-Horizon Retention Multiplier: In steady-state subscription businesses, CLV can be expressed conceptually via a retention multiplier that balances constant annual contribution margin against the discount rate and annual churn probability.
- Finite-Horizon Cohort Survival Models: In enterprise B2B software, analysts model customer survival over a defined 3-year or 5-year horizon, tracking empirical renewal probabilities across distinct customer acquisition vintage years.
- Buy-'Til-You-Die (BTYD) Probabilistic Models: The gold standard for non-contractual retail analytics, encompassing the Pareto/NBD and Beta-Geometric/Negative Binomial Distribution (BG/NBD) models.
- Latent Transaction & Dropout Rates in BTYD: BTYD models assume that while a customer is 'alive', their transaction arrivals follow a Poisson distribution, but they face an unobserved hazard rate of dropping out permanently after each transaction.
- P(Alive) Behavioral Scoring: Algorithmic BTYD outputs calculate the exact statistical probability that an individual customer remains an active buyer today, allowing CRM systems to trigger automated win-back workflows when P(Alive) drops below critical thresholds.
- Monetary Value Modeling via Gamma-Gamma: Couples BTYD frequency models with Gamma-Gamma spend distributions to forecast the expected average monetary value of future customer transactions.
3. Strategic Customer Equity Management: CAC-to-CLV Ratios and Tiered Portfolio Governance
Calculating CLV is merely the mathematical prerequisite; the ultimate strategic objective is Customer Equity Management—the systematic optimization of the enterprise customer asset portfolio to maximize total corporate equity.
- The CAC-to-CLV Golden Benchmark (3:1): In modern venture capital and corporate strategy, a healthy, scalable business model demands that customer lifetime value be at least three times the customer acquisition cost (CLV:CAC >= 3.0).
- Diagnosing CAC Imbalances: A ratio below 1:1 indicates that the firm loses money on every customer acquired, signaling an unsustainable cash burn. Conversely, a ratio exceeding 5:1 flags severe under-investment in marketing, showing the firm is growing too cautiously and conceding territory to aggressive rivals.
- CAC Payback Period Horizon: The time required for a newly acquired customer to generate sufficient gross margin to fully pay back their upfront acquisition expenditure. Best-in-class SaaS and subscription models target CAC payback within 6 to 12 months.
- The Customer Portfolio Tiering Matrix (Zeithaml): Segments customer bases into four distinct profitability tiers:
- Platinum Tier: Heavy spenders, highly loyal, low cost to serve; pamper with VIP perks and dedicated account managers.
- Gold Tier: Heavy spenders who demand discounts; provide volume incentives to encourage brand commitment.
- Iron Tier: Moderate volume that covers overhead; automate service touchpoints to preserve margins.
- Lead Tier: Demanding customers whose cost to serve exceeds gross contribution; reprice, automate, or gracefully de-market.
- Expansion Revenue & Negative Net Churn: Upselling and cross-selling existing accounts so that expansion revenue from retained customers outpaces the revenue lost from churned accounts, driving compounding organic growth.
- Valuation Multiplier in Capital Markets: Wall Street and private equity investors award premium valuation multiples to enterprises with high, predictable recurring customer lifetime value profiles.
4. Comparative Framework: Historical CLV vs Predictive Probabilistic CLV
The comparative matrix below delineates the core differences between retrospective historical CLV tracking and prospective predictive probabilistic CLV modeling.
Analytical Paradigms in Customer Valuation
Strategic ModelingHistorical CLV rewards past loyalty but acts like a rearview mirror; predictive CLV looks through the windshield, identifying high-potential future spenders before they have completed their purchasing lifecycle.
| Evaluation Dimension | Historical (Retrospective) CLV | Predictive (Probabilistic) CLV |
|---|---|---|
| Analytical Orientation | Backward-looking; sums actual historical profit generated by a customer to date. | Forward-looking; forecasts expected net present cash flows over future horizons. |
| Mathematical Methodology | Simple accounting summation: Historical Revenues minus Direct Servicing Costs. | Stochastic probabilistic models (BG/NBD, Gamma-Gamma) and machine learning. |
| Treatment of New Customers | Completely blind; newly acquired high-potential customers are scored as near-zero value. | Accurately scores new customers using early behavioral features and lookalike modeling. |
| Handling of Dormancy & Churn | Cannot distinguish an active customer who is between purchases from a churned user. | Computes exact P(Alive) probabilities to detect silent defection risks. |
| Data Input Requirements | Standard historical ERP/accounting transaction receipts. | Granular recency, frequency, monetary logs, and digital clickstream telemetry. |
| Primary Marketing Use | Calculating historical VIP loyalty status and allocating past customer rewards. | Dynamic CAC bidding in paid search, automated churn alerts, and equity valuation. |
6. Corporate Case Vignette: Starbucks Loyalty Rewards & Customer Equity Monetization
Enterprise Application: How Starbucks Transformed Coffee Drinkers into High-CLV Loyalists
Food & Beverage RetailThe Strategic Challenge: In the hyper-competitive retail coffee sector, consumers can easily defect to local cafes, convenience stores, or competitor chains. Treating customers as single-transaction buyers leads to expensive price discounting that destroys retail store margins.
The CLV Architecture Execution: Starbucks constructed the Starbucks Rewards ecosystem, which now boasts over 30 million active members. By analyzing granular mobile transaction data, Starbucks discovered that an average non-member possesses an estimated CLV of a few hundred dollars, whereas an engaged rewards member generates an astounding lifetime value exceeding $14,000 across their tenure. Starbucks deploys personalized mobile app challenges, customized drink suggestions, and gamified star rewards that dynamically incentivize members to visit during off-peak afternoon hours and trade up to higher-margin food items.
The Commercial Result: Rewards members drive over 55% of all corporate sales in company-operated stores, while the mobile pre-load balances provide Starbucks with over $1.5 billion in interest-free float cash, standing as a global benchmark of customer equity optimization.
7. AKTU University Exam Practice Drill: Solved Questions
University Examination Review: Model Solutions
AKTU MBA PatternQ1: What does the CLV:CAC ratio indicate in customer analytics, and what is considered an optimal benchmark?
Answer: The CLV:CAC ratio measures the relationship between the lifetime profit contribution of a customer and the cost incurred to acquire them. An optimal industry benchmark is 3:1 (CLV should be triple CAC). A ratio below 1:1 indicates an unsustainable, cash-burning acquisition strategy; a ratio exceeding 5:1 indicates under-investment in marketing and overly cautious growth.
Q2: Define Customer Lifetime Value (CLV) and discuss its strategic significance in marketing decision-making. Contrast contractual and non-contractual estimation settings, and explain how customer portfolio tiering guides resource allocation.
Answer Structure Guide:
- Introduction & Conceptual Definition: Define CLV as the net present value of all future cash flows generated across a customer relationship, discounted by the corporate cost of capital. Contrast short-term transactional sales with long-term equity.
- Core Valuation Components: Detail Average Order Value (AOV), Purchase Frequency, Gross Margin percentage, Customer Retention Rate, Discount Rate, and Customer Acquisition Cost (CAC).
- Contractual vs Non-Contractual Settings:
- Contractual: Explicit defection upon contract cancellation (SaaS, gym subscriptions).
- Non-Contractual: Silent defection where customers drift away without notice (retail, e-commerce).
- Explain Buy-'Til-You-Die (BTYD) models (Pareto/NBD and BG/NBD) and the concept of P(Alive) scoring.
- Strategic Customer Equity Management:
- The CAC-to-CLV 3:1 benchmark and CAC payback period targets.
- Explain Zeithaml's 4-tier customer portfolio matrix: Platinum (VIP pampering), Gold (volume incentives), Iron (automated servicing), and Lead (re-pricing or de-marketing).
- Expansion revenue, upselling, cross-selling, and negative net churn dynamics.
- Conclusion: Emphasize that calculating CLV allows marketing executives to justify long-term brand-building and customer retention programs to the CEO and CFO.
Discussion & Questions
0 CommentsAcademic insights, questions, and conceptual clarifications from students & faculty.
No questions or comments yet
Have a doubt about this topic, an exam tip, or a conceptual perspective? Start the discussion below!
Leave a Comment / Ask a Question
Your email address will not be published. Required fields are marked *