
Qualitative Web Analytics, Heuristic Usability Evaluation and Avinash Kaushik's Web Analytics 2.0 Paradigm
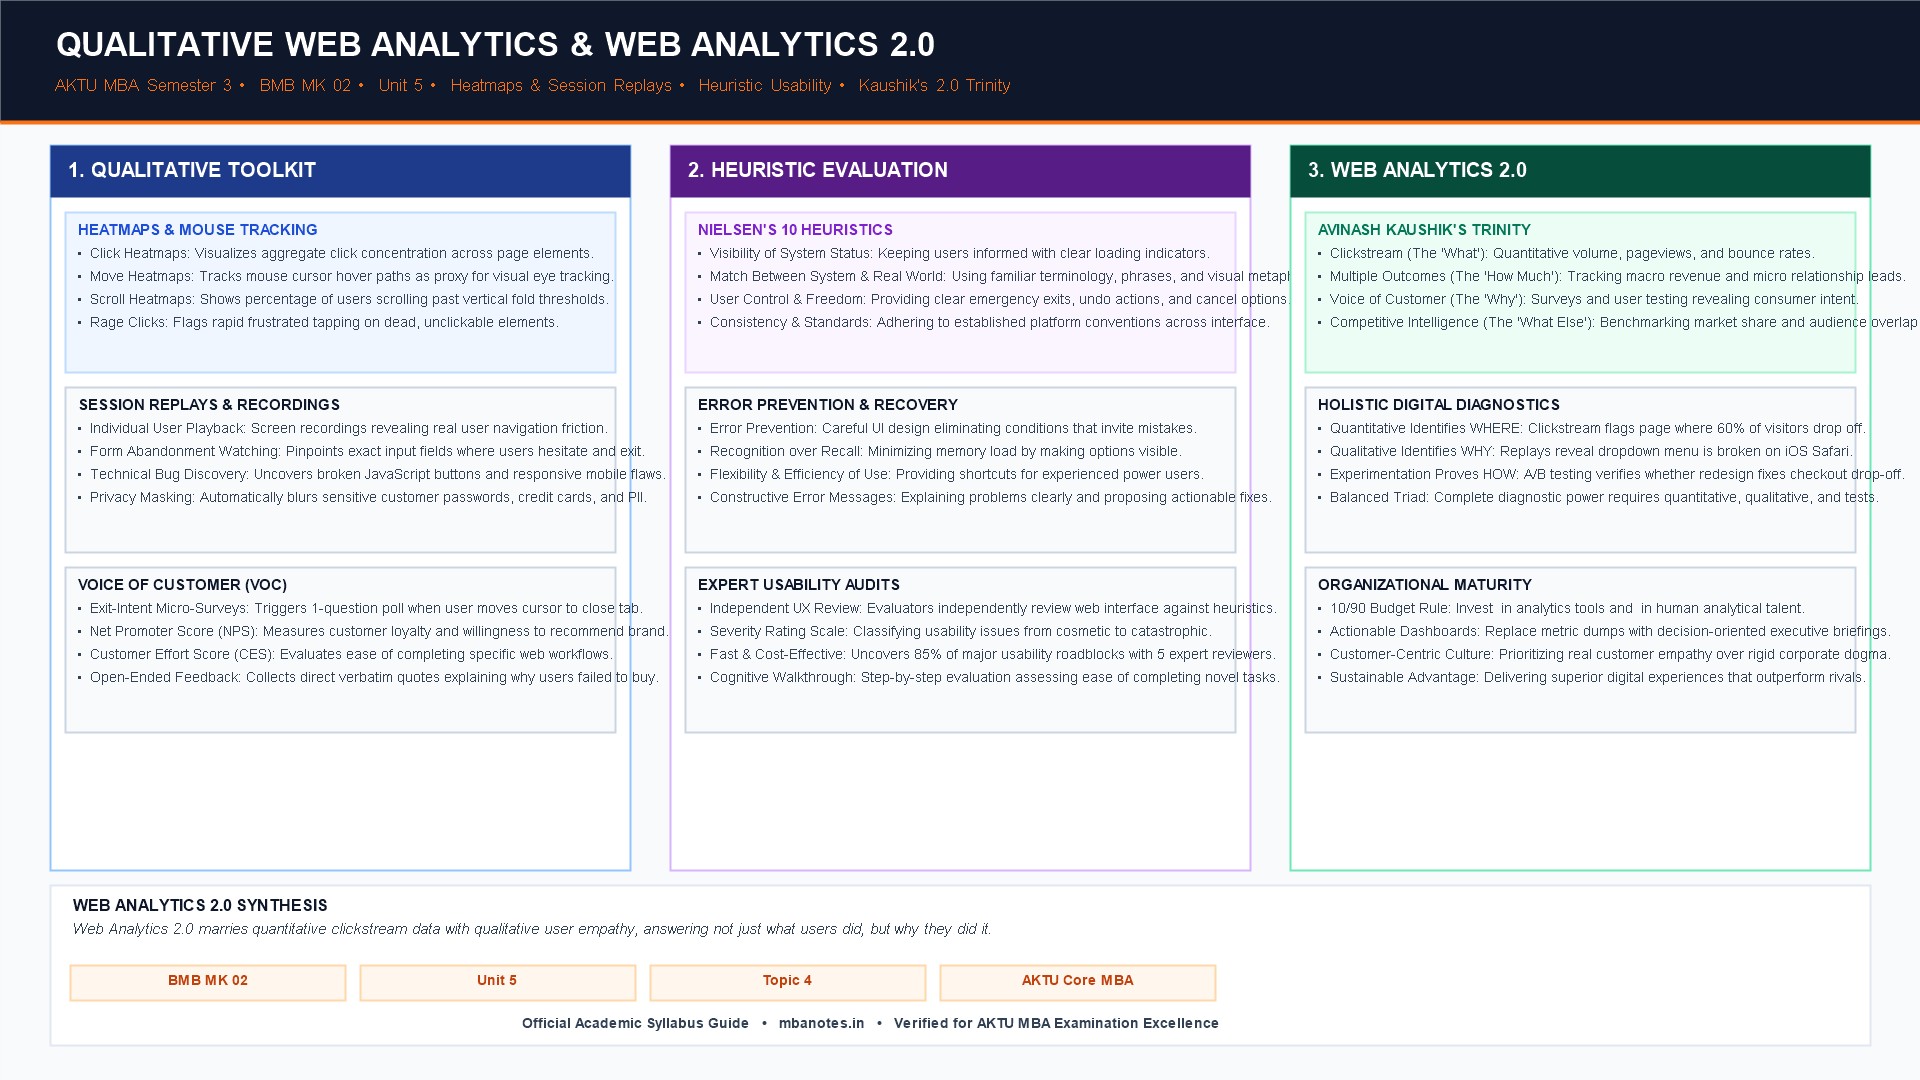
1. Qualitative Web Analytics Toolkit: Click Heatmaps, Scroll Depth and Session Replays
Quantitative web analytics (like Google Analytics 4) is exceptionally proficient at answering What happened (e.g., '62% of visitors dropped off on the payment details page'). However, quantitative tools cannot explain Why it happened. Qualitative web analytics provides the human behavioral visual context, bridging the diagnostic gap between aggregate statistical numbers and authentic user frustration.
The primary qualitative analytics toolkit encompasses several visual diagnostic instruments:
- Click & Tap Heatmaps: Visual overlays mapping aggregate mouse click concentrations using thermal color spectrums (hot red/yellow for dense clicks, cool blue for zero clicks). Reveals whether visitors are clicking primary call-to-action buttons or tapping uselessly on unclickable design graphics.
- Move & Mouse Tracking Heatmaps: Visualizes mouse cursor movement paths across the screen. Eye-tracking research confirms an 85%+ correlation between mouse cursor position and human visual eye gaze, revealing what captures visitor attention.
- Scroll Depth Heatmaps: Shows the exact percentage of visitors who scroll down the webpage past vertical fold thresholds. Identifies whether crucial value propositions or CTA buttons are placed too low below the 'fold' where only 15% of visitors ever see them.
- Rage Click & Dead Click Detection: Algorithms flag instances where a user rapidly and repeatedly clicks an element in frustration (a rage click), exposing broken JavaScript links, frozen dropdown menus, or misleading UI designs.
- Session Replays & User Screen Recordings: Video-like replays capturing exact user browsing journeys, mouse movements, scrolling hesitation, and keyboard keystrokes. Serves as an unvarnished mirror showing real human confusion and responsive mobile rendering bugs.
- Form Abandonment Analytics: Detailed analytics on web forms tracking which specific form field causes users to hesitate the longest, triggers validation error messages, or leads to final abandonment.
- Voice of Customer (VoC) Micro-Surveys: Automated, single-question micro-surveys triggered by exit intent (e.g., when a user moves their mouse toward the browser close button), directly asking: 'What prevented you from completing your purchase today?'.
2. Heuristic Usability Evaluation: Jakob Nielsen's 10 Usability Principles and Audits
While user testing and recordings observe real users, heuristic evaluation is an expert inspection methodology where usability professionals evaluate a digital interface against established psychological usability guidelines. Formulated by human-computer interaction pioneer Dr. Jakob Nielsen, these 10 heuristics serve as the universal benchmark for intuitive software and website design.
- 1. Visibility of System Status: The interface must always keep users informed about what is happening through appropriate visual feedback within a reasonable timeframe (e.g., displaying animated loading spinners, progress bars, and upload meters).
- 2. Match Between System and the Real World: The system should speak the user's language, using words, phrases, and visual metaphors familiar to the user rather than internal corporate jargon or system-oriented technical terms (e.g., using a physical shopping cart icon).
- 3. User Control and Freedom: Users often choose system functions by mistake and need a clearly marked 'emergency exit' to leave the unwanted state without an extended dialogue (e.g., providing clear Undo, Redo, and Cancel options).
- 4. Consistency and Standards: Users should not have to wonder whether different words, situations, or actions mean the same thing across different pages of the website. Follow established platform conventions.
- 5. Error Prevention: Even better than good error messages is a careful design that prevents a problem from occurring in the first place (e.g., disabling the 'Submit' button until all mandatory fields are valid, or auto-formatting credit card spaces).
- 6. Recognition Rather Than Recall: Minimize the user's memory load by making objects, actions, and options visible. The user should not have to remember information from one part of the dialogue to another.
- 7. Flexibility and Efficiency of Use: Accelerators (keyboard shortcuts, saved shipping addresses, one-click ordering) unseen by the novice user may often speed up the interaction for the expert user.
- 8. Aesthetic and Minimalist Design: Dialogues should not contain information that is irrelevant or rarely needed. Every extra unit of information in a dialogue competes with the relevant units of information and diminishes their relative visibility.
- 9. Help Users Recognize, Diagnose, and Recover from Errors: Error messages should be expressed in plain language (no technical error codes), precisely indicate the problem, and constructively suggest a solution.
- 10. Help and Documentation: Even though it is better if the system can be used without documentation, it may be necessary to provide searchable help, tooltips, and contextual FAQs.
3. Avinash Kaushik's Web Analytics 2.0 Paradigm: The Clickstream, Outcomes, VoC Trinity
In his seminal work Web Analytics 2.0, Google Digital Marketing Evangelist Avinash Kaushik redefined the digital measurement philosophy. Kaushik argued that relying solely on traditional clickstream data produces an incomplete, myopic perspective that leads to flawed strategic decisions. Web Analytics 2.0 unifies four foundational measurement pillars into a comprehensive analytical paradigm.
- Pillar 1: Clickstream Data (The 'What'): Measuring the foundational volume and behavioral paths of website traffic—pageviews, unique visitors, bounce rates, visit duration, and clickstreams. Answers: What did visitors do on our site?
- Pillar 2: Multiple Outcomes Analysis (The 'How Much'): Shifting beyond raw pageviews to measure verified financial and relationship outcomes across the marketing funnel:
- Macro Outcomes: Immediate financial revenue realizations, completed e-commerce transactions, and contract signups.
- Micro Outcomes: Relationship-building milestones, newsletter subscriptions, PDF downloads, and account creations that indicate future monetization potential.
- Pillar 3: Voice of Customer - VoC (The 'Why'): Collecting qualitative customer feedback via on-site exit surveys, user usability testing laboratories, and focus groups. Answers: Why did visitors behave the way they did, and why did they leave without buying?
- Pillar 4: Competitive Intelligence (The 'What Else'): Benchmarking performance against external industry competitors using syndicated panels (SimilarWeb) and search intelligence (SEMrush). Answers: How does our traffic share compare to industry rivals, and where are we losing market share?
- The Holistic Diagnostic Triad: Clickstream identifies WHERE the problem exists; Voice of Customer explains WHY the problem exists; and Controlled Experimentation proves HOW to fix it.
4. Comparative Framework: Quantitative Clickstream Analytics vs Qualitative Usability
The comparative matrix below delineates the structural, diagnostic, and operational differences between quantitative clickstream analytics and qualitative usability evaluation.
The Dual Lens of Web Optimization
Strategic ModelingQuantitative clickstream analytics is the macro compass identifying where traffic leaks; qualitative usability is the diagnostic microscope revealing why users struggle and how to fix the friction.
| Evaluation Dimension | Quantitative Clickstream Analytics | Qualitative Usability & Heuristic Evaluation |
|---|---|---|
| Primary Diagnostic Question | 'What happened, how many users visited, and where did they drop off?' | 'Why did users abandon, what confused them, and how did they feel?' |
| Primary Toolset | Google Analytics 4, Adobe Analytics, BigQuery SQL data warehouses. | Hotjar, Crazy Egg, FullStory, user testing labs, Nielsen heuristic audits. |
| Sample Size & Scope | Massive, census-level scale; tracks 100% of website visits and transactions. | Small, focused sample sizes (watching 30-50 session recordings, 5 expert auditors). |
| Data Output Format | Tabular numbers, line charts, conversion percentages, and bounce metrics. | Visual click heatmaps, scroll fold maps, video session replays, and verbatim quotes. |
| Key Strength | Statistical validity; proves whether a trend is broad and commercially significant. | Human empathy; pinpoints exact UI bugs, confusing wording, and visual roadblocks. |
| Key Vulnerability | Emotionally blind; cannot explain customer motivation or underlying user frustration. | Subjective; small sample reviews risk being skewed by unrepresentative individual quirks. |
6. Corporate Case Vignette: Hotjar & Resolving E-Commerce Checkout Friction
Enterprise Application: How Qualitative Heatmaps Diagnosed an Invisible Checkout Bug
Specialty Retail E-CommerceThe Strategic Challenge: A major luxury watch retailer noticed that despite driving premium paid traffic to its mobile website, checkout conversions plunged by 40% on Apple iOS devices. Standard Google Analytics reports showed a massive drop-off at the final payment screen, but quantitative logs revealed zero technical server errors.
The Qualitative Diagnosis: The marketing team deployed qualitative analytics platform Hotjar, filtering session recordings specifically for iOS mobile users who abandoned the payment screen. Watching 20 session replays instantly solved the mystery: on newer iPhone screens, the retailer's software keyboard popped up to enter credit card numbers, but completely covered the 'Place Order' button. Because the mobile page lacked vertical scroll space when the keyboard was open, users repeatedly tapped their screens in frustration (rage clicks) before closing the tab.
The Commercial Result: The development team applied a simple 2-line CSS responsive fix adjusting viewport spacing. Checkout conversion instantly rebounded by 38%, recovering millions of dollars in previously abandoned luxury sales that quantitative analytics alone could never diagnose.
7. AKTU University Exam Practice Drill: Solved Questions
University Examination Review: Model Solutions
AKTU MBA PatternQ1: What are the four core measurement pillars of Avinash Kaushik's Web Analytics 2.0 framework?
Answer: The four pillars of Web Analytics 2.0 are: (1) Clickstream Data (The 'What' - traffic volume and paths); (2) Multiple Outcomes Analysis (The 'How Much' - macro revenue and micro conversions); (3) Voice of Customer - VoC (The 'Why' - surveys, user testing); and (4) Competitive Intelligence (The 'What Else' - benchmarking against rivals).
Q2: Discuss the tools and strategic role of Qualitative Web Analytics. Explain Jakob Nielsen's 10 Heuristics for user interface evaluation, and contrast quantitative clickstream tracking with qualitative usability diagnostics.
Answer Structure Guide:
- Introduction: Define Qualitative Web Analytics as the examination of visual, experiential, and verbatim customer feedback to understand the human reasons behind quantitative metrics.
- The Qualitative Analytics Toolkit:
- Click heatmaps (identifying dead clicks and CTA visibility).
- Move heatmaps (eye-tracking proxy) and Scroll Depth maps (fold optimization).
- Session replays and screen recordings (observing real friction and rage clicks).
- Form abandonment telemetry and exit-intent micro-surveys.
- Jakob Nielsen's 10 Usability Heuristics: Detail key heuristics:
- Visibility of system status (feedback, loading spinners).
- Match between system and real world (familiar metaphors).
- User control and freedom (emergency exits, undo/redo).
- Error prevention and recognition over recall.
- Aesthetic and minimalist design.
- Avinash Kaushik's Web Analytics 2.0 Paradigm: Detail the 4 pillars: Clickstream (What), Outcomes (How Much), Voice of Customer (Why), and Competitive Intelligence (What Else).
- Comparative Synthesis (Quantitative vs Qualitative):
- Quantitative answers 'What happened' at scale; Qualitative answers 'Why users struggle' through empathy.
- Highlight the necessity of combining both: Clickstream flags the leak; Qualitative diagnoses the cause; Experimentation tests the cure.
- Conclusion: Summarize that modern digital marketing managers must cultivate user empathy alongside quantitative rigor to create frictionless, high-converting digital customer experiences.
Discussion & Questions
0 CommentsAcademic insights, questions, and conceptual clarifications from students & faculty.
No questions or comments yet
Have a doubt about this topic, an exam tip, or a conceptual perspective? Start the discussion below!
Leave a Comment / Ask a Question
Your email address will not be published. Required fields are marked *