
Service Design & Blueprinting: Customer Journey Mapping, Line of Visibility & Capacity Strategies
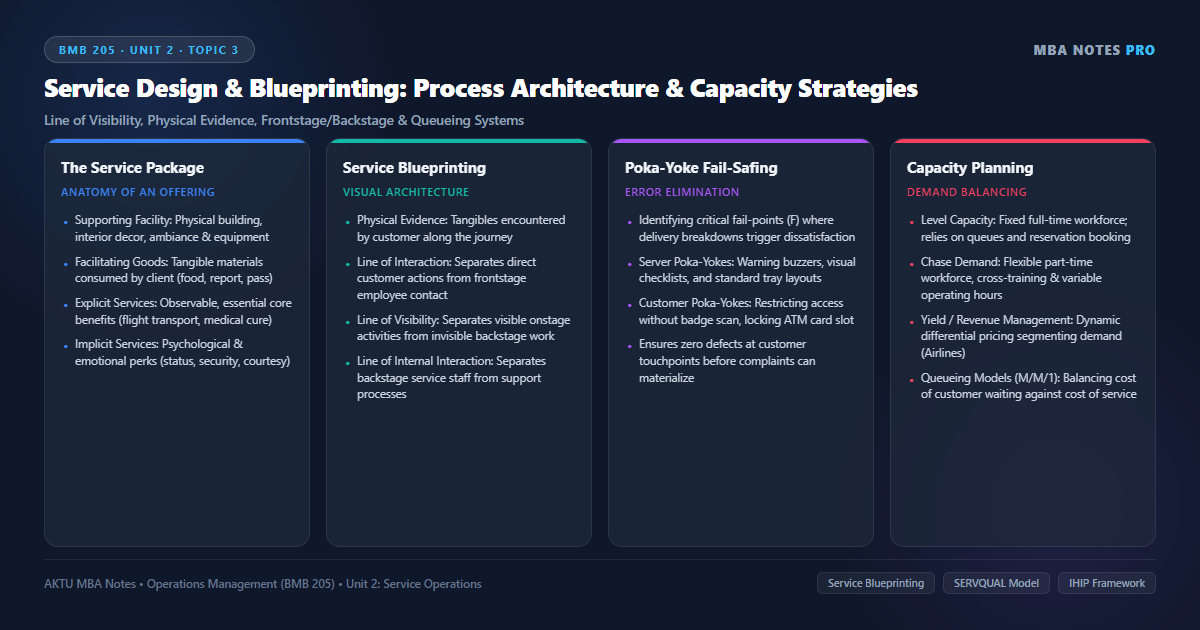
1. The Service Package: Deconstructing the Customer Value Proposition
In operations management, an offering is rarely a single isolated service. Rather, customers purchase a Service Package — a bundle of goods and services provided in a specific operational environment. Proposed by James Fitzsimmons, the Service Package consists of five interconnected elements:
- 1. Supporting Facility: The physical location and infrastructure where the service takes place, including architectural layout, signage, aesthetic interior decor, lighting, and capital equipment (e.g., an IndiGo Airbus A321 aircraft, a Marriott luxury resort building, an Apollo Hospitals surgical suite).
- 2. Facilitating Goods: The physical tangible items purchased or consumed by the customer during the service encounter, or provided by the customer to be treated (e.g., boarding passes, in-flight meals, diagnostic medical test reports, surgical dressings).
- 3. Information: Real-time data and customer-provided inputs that enable customized, accurate service delivery (e.g., passenger flight booking records, patient medical history records, GPS live tracking coordinates on an Uber app).
- 4. Explicit Services: The primary, observable, core benefits that form the essential reason for purchase (e.g., safe transportation from Delhi to Mumbai, successful surgical cure of coronary blockage, accurate financial auditing).
- 5. Implicit Services: The psychological and subtle sensory perks that accompany the service (e.g., feeling of security in a branded hotel, status associated with flying business class, warm empathy shown by a caring nurse).
2. Service Blueprinting: The Architectural Map of Service Delivery
Developed by G. Lynn Shostack (1984), Service Blueprinting is a specialized visual flowcharting technique that maps out the entire service delivery process across customer journey touchpoints, frontstage activities, backstage activities, and support infrastructure.
The Five Horizontal Layers & Three Critical Boundary Lines:
Every tangible cue that the customer encounters along their journey (website UI, parking signage, reception desk, employee uniforms, bills, receipts).
The sequential chronological steps, choices, and activities performed by the customer (arriving at hotel, checking in, eating, settling bill).
Activities performed by frontline service personnel that are directly visible to the customer (receptionist greeting guest, flight attendant serving coffee).
Activities performed by contact personnel away from the customer’s sight (kitchen chefs cooking meals, telephone operators taking room reservations).
Internal enterprise systems, software platforms, and non-contact staff that support delivery (cloud servers, credit card payment gateways, laundry cleaning).
3. Fail-Points & Poka-Yoke Fail-Safing in Service Delivery
A primary managerial objective of Service Blueprinting is the identification of Fail Points (marked with a bold ‘F’ on blueprints) — critical process junctures where operational execution is vulnerable to breakdowns that cause customer dissatisfaction or service delay.
To eliminate errors at fail points, operations managers implement Poka-Yoke (Mistake-Proofing) devices, categorized into server fail-safes and customer fail-safes:
| Poka-Yoke Category | Operational Error Being Prevented | Real-World Practical Mechanism |
|---|---|---|
| Server: Task Errors | Performing the wrong task, in the wrong order, or omitting an essential step. | Pre-printed surgical checklists (WHO protocol); color-coded surgical tool trays; electronic point-of-sale prompts that will not proceed until order size is entered. |
| Server: Treatment Errors | Failing to acknowledge customer, lack of courtesy, cold interpersonal communication. | Four Seasons “Eye Contact within 10 Feet” training rule; computerized customer profile screens alerting staff to guest anniversary or birthday. |
| Customer: Preparation Errors | Arriving without required documents or medical preparation (e.g., eating before fasting blood test). | Automated SMS reminders 24 hours prior; appointment confirmation checklist requiring digital sign-off before entering clinic. |
| Customer: Encounter Errors | Forgetting ATM card in machine; leaving personal belongings; standing in wrong queue. | ATM programming requiring customer to remove their debit card before the cash dispensing slot opens; airport serpentine stanchions directing one-way queue flow. |
4. Service Capacity Strategies & Queueing Models (M/M/1 Waiting Lines)
Because service capacity cannot be stored in inventory, operations managers must balance the economic cost of providing capacity against the economic and psychological cost of making customers wait.
The Three Classic Service Capacity Strategies:
- 1. Level Capacity Strategy: Operating at a constant, fixed capacity regardless of demand fluctuations. High asset and labor utilization, but results in severe customer queues during peak periods and lost sales (e.g., university lecture halls, public sector banks).
- 2. Chase Demand Strategy: Dynamically adjusting capacity to match demand surges in real time. Achieved through cross-trained workers, part-time seasonal staffing, flexible shift rosters, and adjustable seating layouts (e.g., retail supermarkets opening extra cash counters on weekends).
- 3. Yield / Revenue Management: Maximizing revenue from a perishable, fixed-capacity asset by segmenting customers into different price-sensitivity brackets and dynamically adjusting prices over time (e.g., airline ticket pricing, Uber surge pricing, dynamic hotel room rates).
Where \(\lambda\) = Mean arrival rate (customers/hour following Poisson distribution); \(\mu\) = Mean service rate (customers/hour following Exponential distribution), with condition \(\mu > \lambda\) for steady-state equilibrium.
Problem: At an automated drive-through espresso coffee counter, customers arrive at an average rate of 12 cars per hour (\(\lambda = 12\)) according to a Poisson distribution. The single barista can prepare and serve coffee at an average rate of 15 cars per hour (\(\mu = 15\)) with exponential service times. Calculate: (a) Server Utilization Factor (\(\rho\)), (b) Average number of cars in the system (\(L\)), (c) Average time a customer spends in the system (\(W\)), and (d) Average time a customer waits in queue before being served (\(W_q\)).
\(\rho = \frac{\lambda}{\mu} = \frac{12}{15} = \mathbf{0.80 \text{ (or 80%)}}\).
Operating Meaning: The barista is busy serving customers 80% of the time, and idle 20% of the time.
Step 2: Compute Average Number of Cars in the System (\(L\)):
\(L = \frac{\lambda}{\mu – \lambda} = \frac{12}{15 – 12} = \frac{12}{3} = \mathbf{4 \text{ cars}}\).
Step 3: Compute Average Time in System (\(W\)):
\(W = \frac{1}{\mu – \lambda} = \frac{1}{15 – 12} = \frac{1}{3} \text{ hour} = \frac{1}{3} \times 60 = \mathbf{20 \text{ minutes}}\).
Step 4: Compute Average Time Waiting in Queue (\(W_q\)):
\(W_q = \frac{\lambda}{\mu(\mu – \lambda)} = \frac{12}{15(15 – 12)} = \frac{12}{15 \times 3} = \frac{12}{45} \text{ hour} = \frac{12}{45} \times 60 = \mathbf{16 \text{ minutes}}\).
Managerial Conclusion: A customer spends an average of 16 minutes waiting in queue and 4 minutes being served, totaling 20 minutes in the drive-through system.
Corporate Case Vignette: Domino’s Pizza India (Jubilant FoodWorks) 30-Minute Delivery Blueprinting
Domino’s Pizza India (operated by Jubilant FoodWorks), dominating over 70% of the organized pizza delivery market in India, engineered its entire business model around a rigorous Service Blueprint:
- The Operational Guarantee: “30 Minutes or Free” — a high-stakes service promise that required eliminating every second of process friction across backstage and frontstage operations.
- Backstage Assembly-Line Kitchen Blueprint: Customer orders placed on the mobile app appear instantly on Kitchen Display System (KDS) monitors above the make-line. The pizza base stretching, saucing, cheesing, and topping are completed in exactly 2.5 minutes.
- Poka-Yoke Conveyor Baking: Instead of manual ovens, Domino’s uses specialized conveyor-belt impingement ovens calibrated at precisely 240°C. Pizzas pass through the oven in exactly 6 minutes, guaranteeing 100% bake consistency with zero server task errors.
- Frontstage Delivery Execution: The packaging, quality check, and rider dispatch take 1.5 minutes. This leaves a comfortable 20-minute delivery window for the bike rider to navigate within a strictly mapped 3-kilometer delivery radius.
- Measurable Impact: Domino’s operates over 1,900 outlets across India, fulfilling over 98% of orders within the 30-minute threshold while keeping transit-related traffic incidents near zero through algorithmic zone boundaries.
Managerial Takeaway: A service guarantee is only as good as the underlying service blueprint; baking standardization, conveyor poka-yokes, and strict geographic radius constraints turn marketing promises into repeatable operational execution.
AKTU University Examination Questions: Service Design, Blueprinting & Capacity Planning
Section A (2 Marks Conceptual Questions):
Q1: What is the ‘Line of Visibility’ in a Service Blueprint? (2 Marks)
Q2: Distinguish between Chase Demand and Level Capacity strategies in services. (2 Marks)
Section B / C (10 Marks Detailed Analytical Question):
Q: Explain the components of the Service Package. Detail the concept, architectural layers, and boundary lines of a Service Blueprint with a neat diagram. A single-server service counter experiences arrival rate \(\lambda = 10\) customers/hr and service rate \(\mu = 12\) customers/hr. Calculate (a) Server Utilization, (b) Average customers in system, and (c) Average time in system. Discuss Server vs Customer Poka-Yokes with examples. (10 Marks)
1. The Service Package: Explain Supporting Facility, Facilitating Goods, Information, Explicit Services, and Implicit Services with hospital or hotel examples.
2. Service Blueprint Architecture: Diagram showing Physical Evidence, Customer Actions, Line of Interaction, Onstage Contact, Line of Visibility, Backstage Actions, Line of Internal Interaction, and Support Processes.
3. Complete Step-by-Step Numerical Solution:
• \(\rho = \frac{\lambda}{\mu} = \frac{10}{12} = \mathbf{0.833 \text{ (83.33\% utilization)}}\).
• \(L = \frac{\lambda}{\mu – \lambda} = \frac{10}{12 – 10} = \frac{10}{2} = \mathbf{5 \text{ customers in system}}\).
• \(W = \frac{1}{\mu – \lambda} = \frac{1}{12 – 10} = \frac{1}{2} \text{ hr} = \mathbf{30 \text{ minutes in system}}\).
4. Poka-Yoke Mistake Proofing: Detail Server task/treatment poka-yokes (checklists, cash drawer beeps) and Customer encounter poka-yokes (card removal before ATM cash dispensing).
5. Capacity Management Strategies: Contrast Level Capacity vs Chase Demand vs Yield Management.
6. Corporate Case Reference: Cite Domino’s Pizza India 30-minute delivery blueprint and conveyor oven poka-yoke.
Discussion & Questions
0 CommentsAcademic insights, questions, and conceptual clarifications from students & faculty.
No questions or comments yet
Have a doubt about this topic, an exam tip, or a conceptual perspective? Start the discussion below!
Leave a Comment / Ask a Question
Your email address will not be published. Required fields are marked *