
Service Quality Management: The RATER Framework, Parasuraman's 5 Gaps & The SERVQUAL Instrument
1. The Conceptual Foundations of Service Quality: Expectations vs Perceptions
Unlike manufacturing where quality is measured objectively by conforming to physical dimensional tolerances (e.g., ±0.05 mm), Service Quality is inherently subjective, psychological, and experiential. In the seminal conceptualization developed by A. Parasuraman, Valarie Zeithaml, and Leonard Berry (PZB), service quality is defined as the customer’s overall evaluation of the service encounter:
Where \(Q\) = Perceived Service Quality score, \(P\) = Customer’s perception of the actual service delivered, and \(E\) = Customer’s prior expectations of the service.
- When \(P > E\) (\(Q > 0\)): Service exceeds expectations → Customer Delight & Brand Advocacy.
- When \(P = E\) (\(Q = 0\)): Service matches expectations → Customer Satisfaction / Indifference.
- When \(P < E\) (\(Q < 0\)): Service falls below expectations → Unacceptable Quality & Customer Churn.
The Formation of Customer Expectations:
Customer expectations are not static; they are dynamically shaped by four external forces: (1) Word-of-Mouth Communications from friends and social media reviews, (2) Personal Needs and Urgency, (3) Past Experience with the organization or its competitors, and (4) External Communications (advertising promises, marketing claims, and pricing cues).
2. The RATER Framework: Five Dimensions of Service Quality
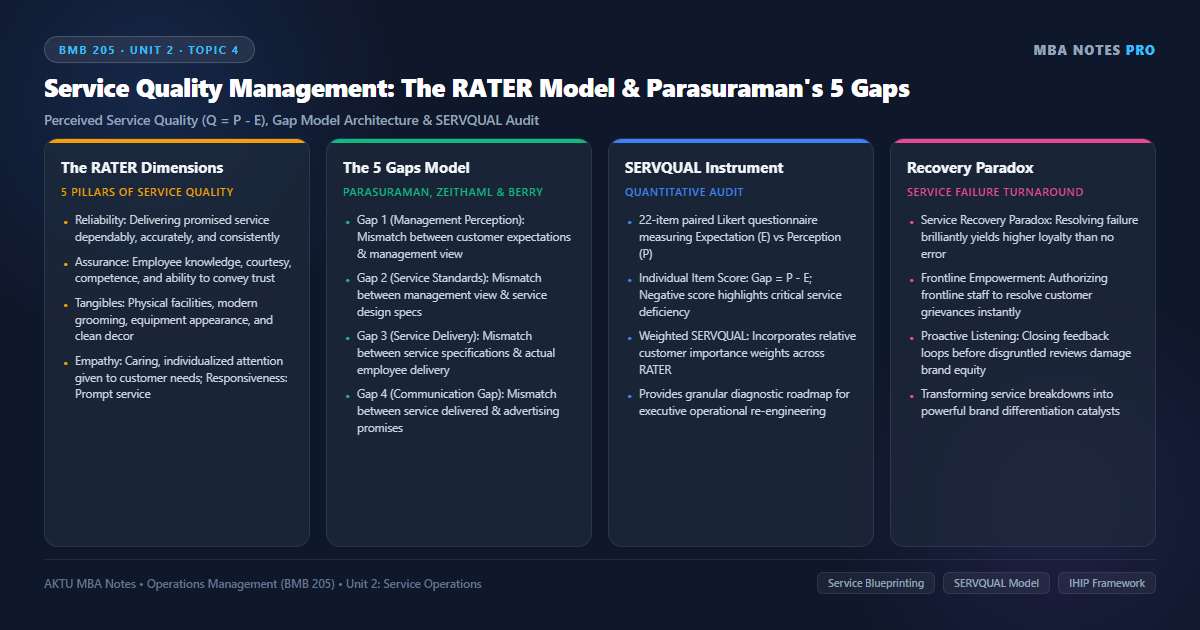
Through extensive empirical research across banking, retail, repair, and credit card services, Parasuraman, Zeithaml, and Berry condensed ten initial quality parameters into the globally celebrated RATER Framework:
1. Reliability (Highest Customer Weight)
The ability to perform the promised service dependably, accurately, and consistently. Delivering right the first time (e.g., flight departs on time, bank statement has zero billing errors, courier arrives by promised hour). Empirical research confirms that Reliability is consistently ranked by customers as the most critical dimension across all service industries.
2. Assurance
The knowledge, technical competence, and courtesy of employees, and their ability to convey trust, safety, and confidence. Crucial in high-risk services like surgery, wealth management, and air travel (e.g., an airline pilot’s professional demeanor, a surgeon’s clear pre-op explanation).
3. Tangibles
The physical evidence of the service: condition and cleanliness of physical facilities, modern appearance of computers and machinery, professional grooming and uniforms of staff, and neatness of printed brochures and billing statements.
4. Empathy
Caring, individualized attention provided to customers. Making the customer feel uniquely valued rather than treated as an anonymous account number (e.g., hotel remembering a guest’s dietary allergy, bank manager addressing a client by name).
5. Responsiveness
The willingness of frontline staff to help customers and provide prompt, enthusiastic service. Slashes customer waiting time and resolves queries immediately (e.g., prompt answering of customer support calls within 3 rings, quick food service).
3. Parasuraman, Zeithaml & Berry (PZB) 5 Gaps Model of Service Quality
The PZB 5 Gaps Model provides an executive diagnostic framework for identifying the systemic organizational failures that cause poor service quality:
| Gap Identifier | Organizational Disconnect | Primary Root Causes | Management Remedial Action |
|---|---|---|---|
| Gap 1: Management Perception Gap | Difference between what customers actually expect and what management thinks they expect. | Lack of market research; insufficient upward communication from frontline staff; hierarchical insulation of senior leadership. | Conduct regular customer expectation audits; implement direct management listening programs at the frontline. |
| Gap 2: Service Standards Gap | Difference between management’s perception of customer expectations and the actual service specifications/standards established. | Management assuming customer expectations are unrealistic or too costly; absence of formal service goal setting; vague SOPs. | Establish specific, quantifiable service standards (e.g., “answer phone in 2 rings”, “deliver pizza in 30 minutes”); use service blueprinting. |
| Gap 3: Service Delivery Gap | Difference between established service quality specifications and the actual service delivered by frontline employees. | Poor employee-job fit; inadequate training; role conflict; lack of perceived supervisory control; frontline burnout; technology breakdowns. | Empower frontline workers; provide rigorous behavioral and technical training; institute peer mentoring; deploy server poka-yokes. |
| Gap 4: Communication Gap | Difference between what is delivered to the customer and what is promised in external advertising/sales pitches. | Marketing department overpromising to hit sales quotas; lack of coordination between marketing and operations. | Enforce strict operational review of all advertising claims; adopt “Underpromise and Overdeliver” policy. |
| Gap 5: Customer Satisfaction Gap | The overarching cumulative gap: Difference between Expected Service and Perceived Service. | Cumulative consequence of Gaps 1, 2, 3, and 4: \(\text{Gap 5} = f(\text{Gap 1}, \text{Gap 2}, \text{Gap 3}, \text{Gap 4})\). | Systematically close internal Gaps 1 through 4; establish continuous closed-loop customer feedback. |
4. The SERVQUAL Diagnostic Survey Instrument & The Service Recovery Paradox
To measure the 5 Gaps mathematically, Parasuraman, Zeithaml, and Berry created the SERVQUAL Instrument — a standardized 22-item survey using a 7-point Likert scale that measures customer expectations and perceptions across the RATER dimensions.
Where \(P_i\) = Perception score for item \(i\); \(E_i\) = Expectation score for item \(i\); \(w_j\) = Importance weight allocated by customer to dimension \(j\) (such that \(\sum w_j = 1.0\)); and \(n_j\) = Number of survey items in dimension \(j\).
Problem: Apex Commercial Bank conducted a SERVQUAL survey on a 7-point Likert scale (1 = Strongly Disagree, 7 = Strongly Agree) across the 5 RATER dimensions. The audit revealed the following average Perception (P) scores, Expectation (E) scores, and Customer Importance Weights (w):
• Reliability: \(P = 5.2\), \(E = 6.8\), Weight \(w = 0.35\).
• Assurance: \(P = 6.0\), \(E = 6.5\), Weight \(w = 0.20\).
• Tangibles: \(P = 6.4\), \(E = 5.8\), Weight \(w = 0.10\).
• Empathy: \(P = 4.8\), \(E = 6.2\), Weight \(w = 0.15\).
• Responsiveness: \(P = 5.0\), \(E = 6.6\), Weight \(w = 0.20\).
Calculate: (a) Individual Gap score for each dimension, (b) Unweighted Average SERVQUAL Score, and (c) Weighted SERVQUAL Score.
• Reliability Gap: \(5.2 – 6.8 = \mathbf{-1.60}\)
• Assurance Gap: \(6.0 – 6.5 = \mathbf{-0.50}\)
• Tangibles Gap: \(6.4 – 5.8 = \mathbf{+0.60}\) (Exceeds expectations!)
• Empathy Gap: \(4.8 – 6.2 = \mathbf{-1.40}\)
• Responsiveness Gap: \(5.0 – 6.6 = \mathbf{-1.60}\)
Step 2: Compute Unweighted Average SERVQUAL Score:
\(SQ = \frac{(-1.60) + (-0.50) + (+0.60) + (-1.40) + (-1.60)}{5} = \frac{-4.50}{5} = \mathbf{-0.90}\).
Step 3: Compute Weighted SERVQUAL Score (\(WSQ\)):
\(WSQ = (0.35 \times -1.60) + (0.20 \times -0.50) + (0.10 \times +0.60) + (0.15 \times -1.40) + (0.20 \times -1.60)\)
\(WSQ = -0.560 – 0.100 + 0.060 – 0.210 – 0.320 = \mathbf{-1.13}\).
Managerial Interpretation: The overall service quality is significantly deficient (\(WSQ = -1.13\)). While physical tangibles are impressive (+0.60), the bank is severely failing in Reliability (-1.60) and Responsiveness (-1.60), which carry 55% of total customer importance weight. Operations must re-engineer transaction accuracy and line waiting times immediately.
The Service Recovery Paradox:
The Service Recovery Paradox is the empirically proven phenomenon where a customer who experiences a serious service failure, but has their problem resolved rapidly, empathetically, and generously by frontline staff, ends up having higher loyalty and repeat purchase intent than a customer who experienced completely flawless, error-free service! When things go wrong, the firm has a unique psychological window to demonstrate heroic commitment to the customer.
Corporate Case Vignette: The Taj Hotels’ Legendary Service Empathy & Empowerment Framework
The Indian Hotels Company Limited (IHCL / Taj Hotels) represents the gold standard of global hospitality service quality, consistently winning international acclaim for flawless reliability and emotional empathy:
- The ‘Taj Swikriti’ Culture of Frontline Empowerment: Frontline staff are granted discretionary budgets to resolve any guest dissatisfaction on the spot (e.g., upgrading a room, waiving laundry bills, preparing custom meals for sick infants) without seeking managerial approval.
- Closing Gap 1 & Gap 2: Senior leadership conducts daily morning briefings reviewing unscripted guest preferences logged in the centralized CRM system. If a repeat guest preferred chamomile tea in London, it is waiting in their room when they check into Taj Mahal Palace, Mumbai.
- Closing Gap 3 with Values-Based Recruitment: Rather than hiring solely for technical skills, Taj recruits candidates from smaller towns for intrinsic emotional values: integrity, humility, and willingness to serve.
- The Ultimate Test of Service Quality (26/11): During the tragic 2008 Mumbai terror attacks, Taj employees famously placed themselves in harm’s way to guide guests to safety, not a single employee abandoned their post, creating a Harvard Business School case study on customer devotion.
Managerial Takeaway: World-class service quality cannot be enforced solely through procedural manuals; it requires an organizational culture of genuine human empathy and empowered frontline decision-making.
AKTU University Examination Questions: Dimensions of Service Quality & SERVQUAL
Section A (2 Marks Conceptual Questions):
Q1: What does the RATER acronym stand for in service quality? (2 Marks)
Q2: What is the ‘Service Recovery Paradox’? (2 Marks)
Section B / C (10 Marks Detailed Analytical Question):
Q: Explain the Parasuraman, Zeithaml, and Berry (PZB) 5 Gaps Model of Service Quality with a neat diagram. Detail each gap’s root causes and operational remedies. In a SERVQUAL survey, a restaurant receives: Reliability (P=5.0, E=6.5, w=0.30), Assurance (P=6.0, E=6.0, w=0.20), Tangibles (P=6.5, E=5.5, w=0.15), Empathy (P=4.5, E=6.0, w=0.15), Responsiveness (P=4.8, E=6.2, w=0.20). Calculate the Weighted SERVQUAL Score and interpret the results. (10 Marks)
1. Conceptual Foundation of Service Quality: Explain Perceived Quality equation \(Q = P – E\); detail why service quality is subjective and multidimensional.
2. The RATER Dimensions: Define Reliability, Assurance, Tangibles, Empathy, and Responsiveness with banking or hotel examples.
3. PZB 5 Gaps Model Architecture: Diagram showing Gap 1 (Management Perception), Gap 2 (Service Standards), Gap 3 (Service Delivery), Gap 4 (Communication), and Gap 5 (Expected vs Perceived Quality). Detail root causes and remedies for each gap.
4. Complete Step-by-Step Numerical Solution:
• Reliability: \(5.0 – 6.5 = -1.50 \times 0.30 = -0.450\)
• Assurance: \(6.0 – 6.0 = 0.00 \times 0.20 = 0.000\)
• Tangibles: \(6.5 – 5.5 = +1.00 \times 0.15 = +0.150\)
• Empathy: \(4.5 – 6.0 = -1.50 \times 0.15 = -0.225\)
• Responsiveness: \(4.8 – 6.2 = -1.40 \times 0.20 = -0.280\)
• \(WSQ = -0.450 + 0.000 + 0.150 – 0.225 – 0.280 = \mathbf{-0.805}\).
• Interpretation: The restaurant has an overall negative gap (-0.805), driven by critical shortfalls in Reliability and Responsiveness.
5. Corporate Case Reference: Cite Taj Hotels’ frontline empowerment and culture of empathy.
Discussion & Questions
0 CommentsAcademic insights, questions, and conceptual clarifications from students & faculty.
No questions or comments yet
Have a doubt about this topic, an exam tip, or a conceptual perspective? Start the discussion below!
Leave a Comment / Ask a Question
Your email address will not be published. Required fields are marked *