
Market Sizing Methods: TAM, SAM, SOM Hierarchy, Top-Down vs Bottom-Up Estimation and Market Reconstruction
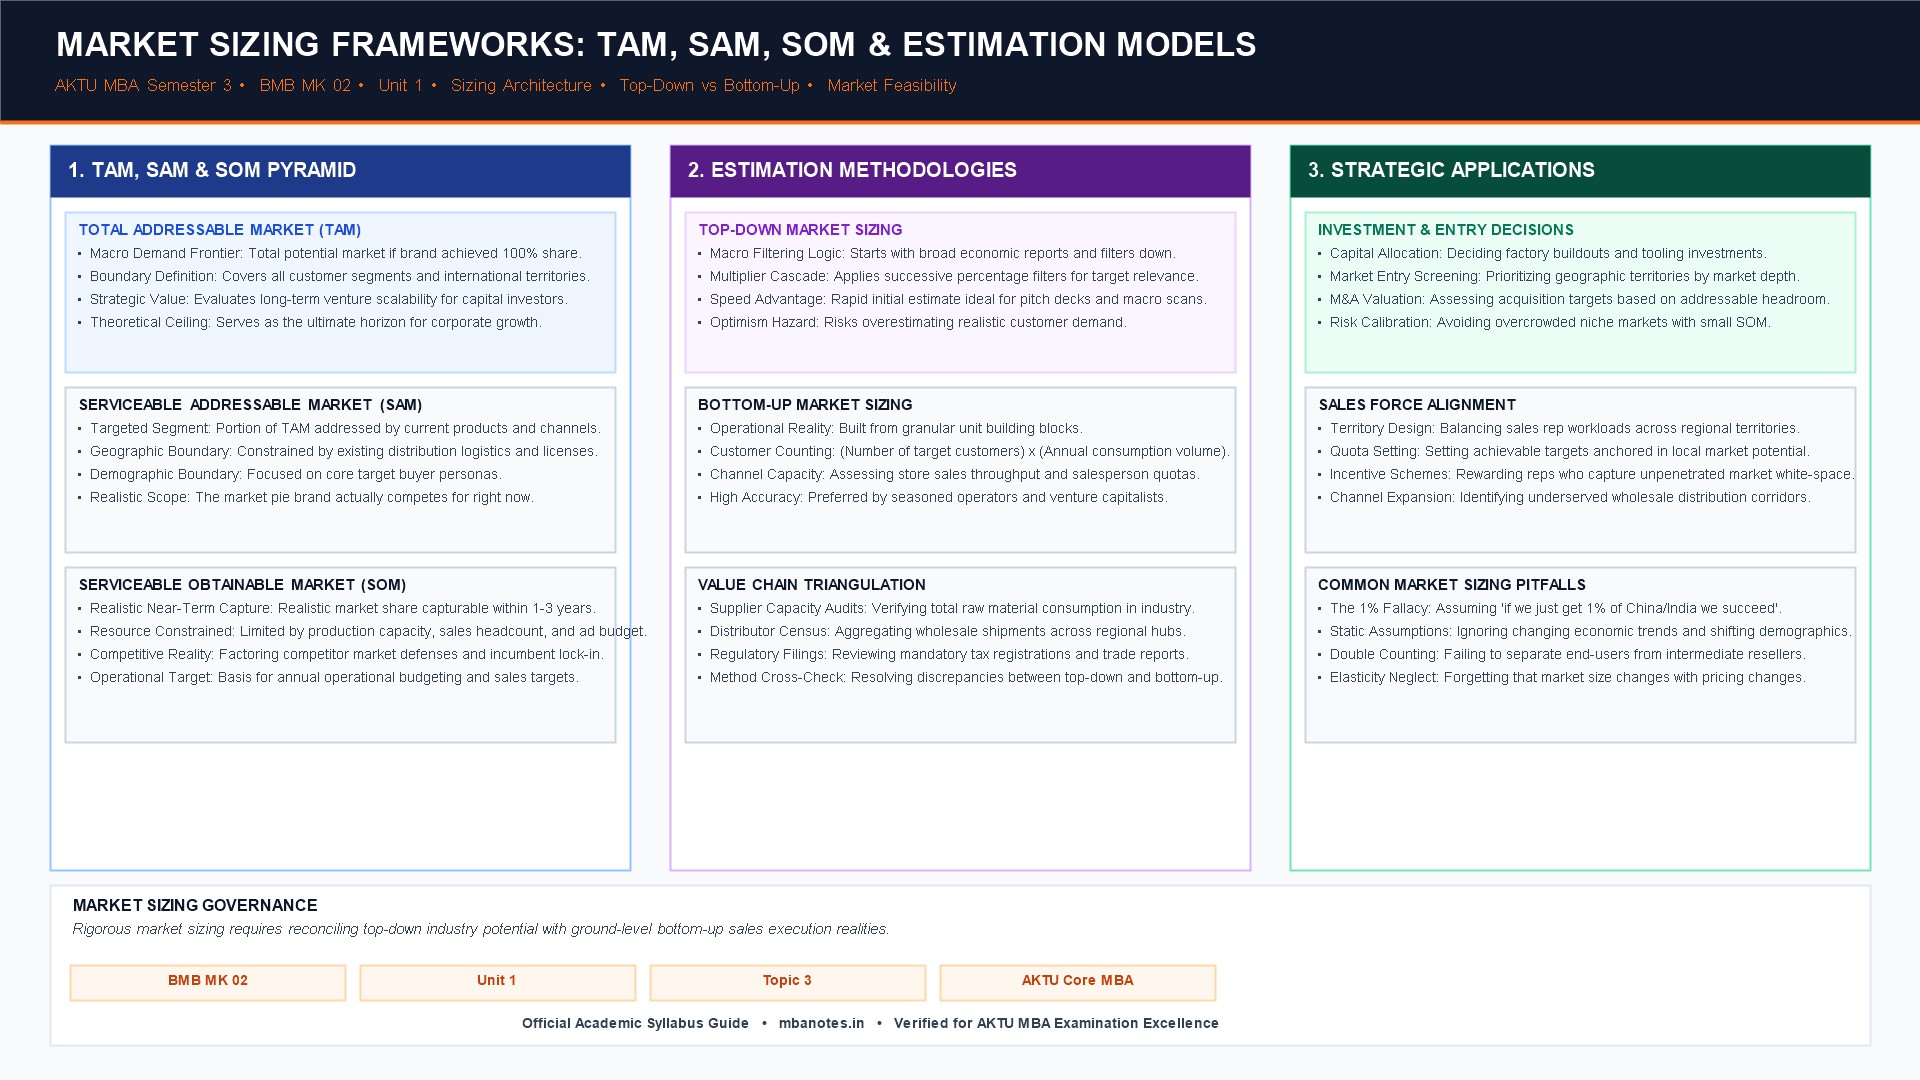
1. Theoretical Architecture of Market Sizing: TAM, SAM, and SOM Hierarchy
Market sizing is the foundational analytical process of quantifying the total commercial potential of a defined industry or product category. Before launching a new venture, deploying capital expenditure, or entering a foreign geography, corporate leadership and venture capital investors must determine whether the addressable market opportunity is sufficiently large to justify commercial risks. Market sizing establishes whether an opportunity represents a niche pond or an expansive ocean.
The foundational framework of market sizing is structured as a concentric three-tier hierarchy:
- Total Addressable Market (TAM): Represents the overall revenue opportunity available if a product achieved 100% market share across all potential customers worldwide, without regard to competitive friction or geographic constraints. TAM defines the ultimate theoretical ceiling of category demand.
- Serviceable Addressable Market (SAM): The specific subset of the TAM that fits the organization's current core competencies, product variants, regulatory licenses, and geographical operational footprint. For example, if TAM is global electric two-wheelers, SAM represents the urban Indian high-speed commuter segment.
- Serviceable Obtainable Market (SOM): The realistic, defensible market share the firm can capture over a defined 1-to-3 year operating horizon, given financial budgets, production factory throughput, dealer distribution limitations, and aggressive rival competition.
- Strategic Sizing Horizon: TAM informs long-term investor enterprise valuation, SAM guides product roadmaps and strategic hiring, while SOM establishes immediate sales quotas and operating budgets.
- Market Value vs Market Volume: Market size can be expressed in total units sold (volume) or aggregate gross revenue generated (value), with value providing a clearer picture of profit pool availability.
- Dynamic Market Elasticity & Growth: Market sizes are not static numbers; they expand or contract dynamically based on GDP growth, urban migration, infrastructure rollouts, and disruptive technology adoption.
2. Top-Down Market Sizing: Industry Reports, Macro Filtering and Population Ratios
The top-down market sizing methodology begins with broad macroeconomic data or aggregate industry research reports, applying sequential narrowing percentage filters to isolate the target customer segment.
- Broad Industry Sizing Reports: Initiates by referencing macroeconomic databases or syndicated industry overviews (such as Gartner, IDC, or World Bank reports) that quantify total national or global sector expenditure.
- Sequential Percentage Filtering (Funneling): Applies demographic and psychographic screening filters sequentially, such as filtering a total national population of 1.4 billion down to urban households, further filtering by middle-income brackets, and finally filtering by smartphone ownership.
- Macro Ratio Adoption Rates: Leverages historical technology adoption curves and category penetration benchmarks from analogous predecessor industries to estimate potential conversion rates.
- Speed & Broad Executive Perspective: Highly advantageous during early-stage exploratory meetings and executive pitch presentations, providing an instant macro perspective without requiring months of field research.
- The '1% Fallacy' Vulnerability: A notorious pitfall where analysts arbitrarily assume that capturing merely 1% of a massive market (e.g., China or India) guarantees guaranteed commercial success, completely ignoring local distribution bottlenecks, regulatory barriers, and fierce domestic rivalry.
- Susceptibility to Compounding Errors: If an initial macro assumption or filtering percentage is slightly skewed, successive multiplication compounds the estimation error, yielding wildly inflated market projections.
3. Bottom-Up Estimation: Unit Capacity, Distribution Channels and Average Revenue
In contrast to top-down filtering, the bottom-up market sizing methodology builds market potential from the ground up by multiplying granular unit operational building blocks, such as potential customer accounts, daily retail transaction velocity, and average revenue per unit.
- Identifiable Target Customer Units: Commences by identifying the precise number of prospective customer units, such as registered hospitals in a healthcare IT analysis, or operating restaurants in a cloud kitchen study.
- Average Order Value (AOV) & Pricing Realization: Multiplies customer count by the realistic expected annual expenditure per account or average selling price per unit.
- Distribution Channel Velocity & Retail Footprint: Calculates throughput across physical retail touchpoints (e.g., number of partnered retail pharmacies multiplied by daily SKU sales per store multiplied by 365 operating days).
- Production Capacity & Resource Constraints: Incorporates realistic manufacturing supply limits, delivery fleet capacity, and sales representative territory coverage thresholds.
- High Empirical Defensibility: Preferred by seasoned CFOs, venture capitalists, and operations leaders because every underlying parameter can be independently stress-tested, audited, and empirically verified.
- Triangulation & Reconciled Synthesis: Best-in-class market analysts never rely on a single methodology; they independently execute both top-down and bottom-up sizing, reconciling the delta to arrive at a robust, verified consensus range.
4. Comparative Framework: Top-Down vs Bottom-Up Market Sizing Approaches
The comparative table below highlights the methodological, operational, and strategic contrasts between top-down macro filtering and bottom-up unit-level market sizing.
Methodological Duality in Market Opportunity Sizing
Strategic ModelingTop-down models provide the macro ceiling and investor narrative, while bottom-up models supply the operational realism and tactical execution roadmap required for sustainable capital investment.
| Evaluation Dimension | Top-Down Market Sizing | Bottom-Up Market Sizing |
|---|---|---|
| Starting Point | Broad macroeconomic data, national census, or aggregate sector reports. | Granular operational units, individual customer accounts, or retail stores. |
| Analytical Mechanism | Sequential percentage filtering funnels (deductive demographic pruning). | Summation of unit sales, channel velocity, and pricing tiers (inductive aggregation). |
| Execution Speed & Effort | Rapid execution; can be formulated within hours using published secondary data. | Requires substantial effort, field interviews, channel audits, and operational modeling. |
| Defensibility & Rigor | Low to moderate; highly vulnerable to subjective percentage assumptions. | High; grounded in observable operational mechanics and verified transaction points. |
| Primary Risk Factor | The '1% Fallacy' and unrealistic optimistic macro-level overestimation. | Failure to account for hidden macro regulatory shifts or unforeseen market expansion. |
| Optimal Business Use | Investor pitch decks, macro TAM scoping, and initial venture screening. | Annual operational budgeting, sales quota allocation, and supply chain capacity planning. |
6. Corporate Case Vignette: Airbnb Market Entry & TAM/SAM Sizing Strategy
Enterprise Application: How Airbnb Defended its Initial TAM/SAM to Investors
Hospitality & Platform EconomyThe Strategic Challenge: In 2008, when Airbnb founders pitched their peer-to-peer home-sharing concept, venture capitalists dismissed the venture as an absurd, tiny niche consisting merely of broke backpackers sleeping on air mattresses in strangers' living rooms.
The Analytical Solution: Airbnb constructed a brilliant bottom-up market sizing model that redefined their category. They bypassed traditional hotel chain revenues and instead quantified global travel room-nights booked via budget portals (totaling over 1.9 billion trips worldwide). They established their TAM at 1.9 billion trips, narrowed their SAM to budget and online bookings (560 million trips), and established their near-term SOM at capturing a realistic 15% market share of serviceable bookings (84 million trips). Multiplying projected booked nights by an average platform take-rate fee of $25 per transaction yielded a highly credible, multi-billion-dollar revenue trajectory.
The Commercial Result: Airbnb's disciplined bottom-up sizing demonstrated to early investors like Sequoia Capital that a seemingly fringe subculture possessed the market potential to disrupt the entire global hospitality hotel sector, ultimately paving the way for a $100 billion public enterprise valuation.
7. AKTU University Exam Practice Drill: Solved Questions
University Examination Review: Model Solutions
AKTU MBA PatternQ1: Define TAM, SAM, and SOM in the context of market sizing.
Answer: TAM (Total Addressable Market) is the theoretical total market demand for a product category if 100% market share were captured. SAM (Serviceable Addressable Market) is the specific portion of TAM targeted by a firm's operational geography, specifications, and channel capabilities. SOM (Serviceable Obtainable Market) is the realistic, near-term market share the firm can capture given competitive barriers and marketing resources.
Q2: Explain the significance of market sizing in strategic marketing. Compare the top-down and bottom-up approaches to market estimation, highlighting their strengths, limitations, and the necessity of triangulation.
Answer Structure Guide:
- Introduction & Strategic Significance: Define market sizing as the quantitative estimation of total commercial market potential. Explain its crucial role in capital allocation, foreign market entry, venture funding, and sales territory budgeting.
- The TAM-SAM-SOM Concentric Hierarchy: Define each layer clearly with a real-world example (e.g., an electric scooter startup targeting urban professionals).
- Top-Down Market Sizing Approach:
- Mechanism: Macro data → Demographic filtering → Percentage adoption.
- Strengths: Rapid formulation, broad strategic view, excellent for macro investor storytelling.
- Weaknesses: The '1% Fallacy', reliance on questionable assumptions, risk of compounded estimation errors.
- Bottom-Up Market Sizing Approach:
- Mechanism: Granular unit customers × Transaction frequency × Average revenue per unit.
- Strengths: Highly defensible, auditable operational building blocks, grounded in actual distribution capacity.
- Weaknesses: Time-consuming fieldwork requirements, potential blind spots regarding emerging macro shifts.
- The Triangulation Imperative: Discuss why leading marketing analysts execute both models in parallel, reconciling discrepancies to establish a robust, verified commercial forecast range.
- Conclusion: Summarize that sound market sizing separates speculative corporate gambles from mathematically grounded strategic market opportunities.
Discussion & Questions
0 CommentsAcademic insights, questions, and conceptual clarifications from students & faculty.
No questions or comments yet
Have a doubt about this topic, an exam tip, or a conceptual perspective? Start the discussion below!
Leave a Comment / Ask a Question
Your email address will not be published. Required fields are marked *