
Portfolio Analysis Tools: BCG Matrix and Ansoff Growth Matrix Frameworks
1. Foundations of Portfolio Planning: Multi-Business Strategic Governance
As modern corporations expand across multiple industries, product lines, and geographic markets, executive leadership can no longer manage every operational activity through direct operational oversight. Instead, corporate headquarters acts as an internal investment bank, managing a collection of semi-autonomous Strategic Business Units (SBUs).
Portfolio Planning Tools provide corporate executives with objective, visual analytical frameworks to answer critical governance questions:
- Which business units generate surplus operating cash flow, and which units chronically consume capital?
- How should limited corporate capital expenditure be prioritized across competing divisional requests?
- Which declining or non-core divisions should be harvested, restructured, or divested?
- What is the optimal balance between mature, stable businesses and risky, high-growth speculative bets?
The Economic Logic of Portfolio Management
- Internal Capital Market Efficiency: Corporate headquarters reallocates capital between divisions far more efficiently, cheaply, and discreetly than external commercial banks or equity markets, avoiding external issuance fees and public scrutiny.
- The Experience Curve & Scale Economies: High market share within an individual industry drives cumulative production volume, unlocking steep learning curve cost reductions that translate directly into higher operating margins.
- Counter-Cyclical Risk Hedging: Operating across uncorrelated industries shields the consolidated corporate parent from catastrophic downturns in any single industrial sector.
- Life Cycle Complementarity: A balanced portfolio harmonizes business units across different stages of the corporate life cycle—infant startups, rapidly scaling growth businesses, mature cash generators, and declining legacy divisions.
2. The BCG Growth-Share Matrix: Four Quadrants & Cash Flow Sequences
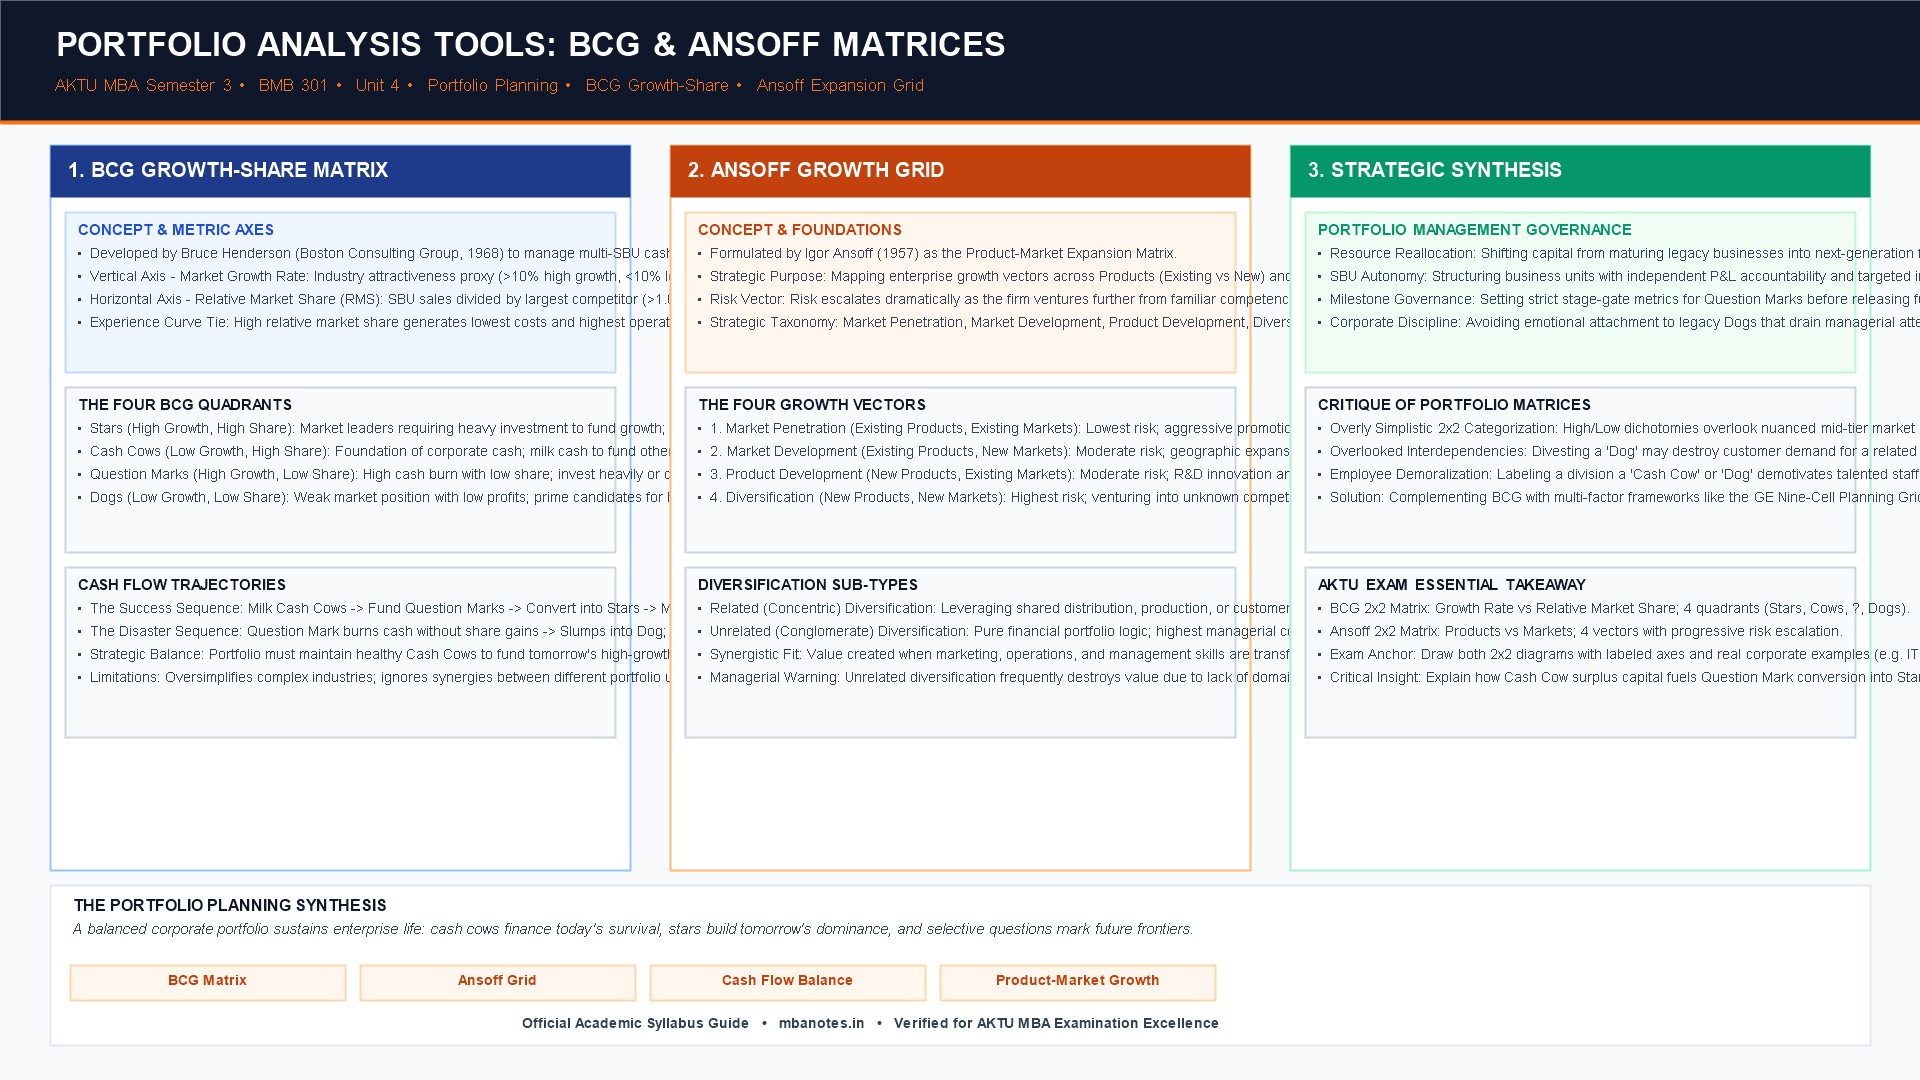
Developed in 1968 by Bruce Henderson, founder of the Boston Consulting Group (BCG), the Growth-Share Matrix is the world's most widely recognized portfolio management model. It maps an enterprise's SBUs onto a two-by-two grid defined by two objective axes:
- Vertical Axis — Market Growth Rate: Serves as an external proxy for industry attractiveness. It measures the annual percentage growth rate of the market in which the SBU competes. High-growth markets (>10% per annum) demand continuous capital expenditures to expand production capacity, build logistics networks, and fund promotional wars. Low-growth markets (< 10%) require minimal expansion capital.
- Horizontal Axis — Relative Market Share (RMS): Serves as an internal proxy for competitive strength and cost leadership. RMS is calculated by dividing the SBU's sales volume by the sales volume of its largest industry competitor. An RMS greater than 1.0 indicates that the SBU is the undisputed market leader, enjoying superior scale economies and learning curve advantages; an RMS below 1.0 indicates a market follower position.
The Four Distinct BCG Quadrants
- Stars (High Growth, High Relative Market Share): Stars are dominant market leaders operating in rapidly expanding industries. Because the market is growing quickly, Stars require substantial capital reinvestment to expand plant capacity and fend off aggressive competitors. However, because they possess high relative market share, they generate immense operating cash flows. Stars are broadly self-sustaining; as industry market growth eventually cools, Stars naturally transition into mature Cash Cows.
- Cash Cows (Low Growth, High Relative Market Share): Cash Cows are the financial foundation of the corporation. Competing in mature, slow-growth industries, they require very little capital expenditure for capacity expansion. Due to their dominant market share and accumulated learning curve efficiencies, they generate massive, highly stable cash surpluses. Management must "milk" Cash Cows diligently, reinvesting maintenance capital to preserve market dominance while channeling surplus cash to fund corporate R&D and high-potential Question Marks.
- Question Marks / Problem Children (High Growth, Low Relative Market Share): Question Marks operate in booming industries with immense commercial promise, but their low market share means they generate meager cash flows while devouring enormous amounts of investment capital. Management faces a critical binary choice: either commit substantial corporate funds to aggressively capture market share and convert the unit into a Star, or divest/exit before the business burns through corporate reserves.
- Dogs (Low Growth, Low Relative Market Share): Dogs occupy weak competitive positions in stagnant or declining industries. They typically generate negligible accounting profits or chronic cash losses, while absorbing a disproportionate amount of executive management time. Common strategic prescriptions for Dogs include harvesting (extracting short-term cash by slashing costs to the bone), selling the unit to a niche operator, or liquidating assets.
The Dynamic Cash Flow Sequences
The BCG matrix is not a static categorization; it is a dynamic cash-reallocation engine governed by two distinct paths:
- The Success Sequence: Surplus cash generated by mature Cash Cows is channeled into selected Question Marks -> Capital infusions enable Question Marks to build market share and convert into dominant Stars -> As industry growth stabilizes, Stars mature into highly lucrative Cash Cows, completing the corporate life cycle.
- The Disaster Sequence: A firm starves its Cash Cows of basic maintenance capital, causing market share to erode into Dogs -> Massive capital is poured indiscriminately into Question Marks that fail to gain market share, sliding into high-cost Dogs -> An under-capitalized Star is overtaken by aggressive rivals, slumping into a Dog. The enterprise accumulates a portfolio of stagnant Dogs and enters financial distress.
3. The Ansoff Product-Market Expansion Grid: The Four Growth Vectors
While the BCG matrix focuses on managing cash across existing businesses, the Product-Market Expansion Grid, formulated in 1957 by strategic pioneer H. Igor Ansoff, provides corporate leaders with a framework for planning directional growth. Ansoff classified growth vectors into a two-by-two grid along two fundamental dimensions: Products (Existing vs New) and Markets (Existing vs New).
The Four Ansoff Strategic Growth Vectors
- 1. Market Penetration (Existing Products, Existing Markets) — Lowest Risk: The firm seeks to sell more of its current products to its existing customer base. Growth is achieved by increasing marketing intensity, launching aggressive promotional campaigns, lowering prices, expanding retail shelf space, and acquiring direct competitors. Because the firm remains in familiar territory with proven products and known buyers, market penetration carries the lowest operational risk.
- 2. Market Development (Existing Products, New Markets) — Moderate Risk: The enterprise takes its established, proven product lines and introduces them into entirely new customer segments or geographic regions. This encompasses international expansion into foreign markets, entering unserved tier-2 and tier-3 domestic towns, or targeting different demographic customer groups (e.g., repositioning a baby shampoo as an ultra-gentle daily shampoo for adults). Risk increases because the firm must navigate unfamiliar distribution channels, local consumer cultures, and regional regulations.
- 3. Product Development (New Products, Existing Markets) — Moderate Risk: The enterprise leverages its trusted relationship with existing customer markets to introduce entirely new, modified, or complementary products. Examples include Apple introducing the Apple Watch to established iPhone users, or a commercial bank offering life insurance products to its savings account depositors. Risk is moderate, driven by R&D engineering uncertainty and the risk of product failure.
- 4. Diversification (New Products, New Markets) — Highest Risk: The enterprise moves simultaneously outside its familiar products and its known customer markets into completely uncharted territory. Ansoff termed diversification the highest-risk strategy because it forces the organization to learn new technologies, build new manufacturing processes, and understand unfamiliar consumer behaviors simultaneously. Diversification divides into:
- Concentric (Related) Diversification: Entering new industries that share technological, manufacturing, or distribution commonalities with the firm's core business (e.g., a leather footwear brand expanding into leather luggage).
- Conglomerate (Unrelated) Diversification: Venturing into completely unrelated industries driven purely by financial returns and portfolio risk-spreading (e.g., a cigarette company acquiring five-star hotels and paper mills).
4. Core Theoretical Framework: BCG & Ansoff Portfolio Matrices Synthesized
Henderson (BCG, 1968) & Ansoff (1957) Strategic Portfolio Frameworks
Corporate sustainability depends on simultaneously managing internal cash liquidity (BCG) and directional growth vectors (Ansoff). Without disciplined portfolio recycling, successful enterprises either drown in unmanageable growth risks or slowly suffocate in maturing, obsolete cash cows.
Cash Equilibrium Logic
BCG dictates that Cash Cows must be protected as capital engines; starving cash cows destroys the financial foundation needed to develop future market leaders.
Selective Question Mark Bets
Question Marks cannot all be funded equally. Management must make concentrated, aggressive bets on high-probability candidates and prune the rest.
Progressive Risk Escalation
Ansoff establishes that strategic risk increases geometrically as an enterprise moves from Market Penetration toward Unrelated Conglomerate Diversification.
Integrated Growth Sequencing
Firms typically exploit Market Penetration and Product Development first to build dominant Cash Cows before venturing into cross-border Market Development and Diversification.
Comprehensive Comparison: BCG Growth-Share Matrix vs Ansoff Expansion Grid
| Analytical Dimension | BCG Growth-Share Matrix | Ansoff Product-Market Grid |
|---|---|---|
| Core Strategic Focus | Multi-business portfolio evaluation, cash flow balancing, and capital allocation across SBUs. | Corporate directional growth strategy, product innovation vectors, and market expansion pathways. |
| Underlying Theoretical Foundation | The Product Life Cycle and the Boston Consulting Group Experience / Learning Curve. | Product-Market Strategy and Corporate Diversification Risk Progression Theory. |
| Primary Analytical Axes | Vertical: Industry Market Growth Rate; Horizontal: Relative Market Share (RMS). | Vertical: Customer Markets (Existing vs New); Horizontal: Products (Existing vs New). |
| Core Strategic Quadrants | Stars, Cash Cows, Question Marks (Problem Children), Dogs. | Market Penetration, Market Development, Product Development, Diversification. |
| Role of Financial Capital | Central focus: Evaluates internal cash generation vs cash consumption to optimize liquidity. | Secondary focus: Evaluates operational risk profile and market feasibility of new growth ventures. |
| Primary Operational Limitation | Oversimplifies industry attractiveness to a single metric (growth); overlooks cross-SBU synergies. | Assumes binary choices (Existing vs New); ignores competitive retaliation and execution capability. |
6. Corporate Case Vignette: ITC Limited's Portfolio Rebalancing Strategy
ITC Limited: A Masterclass in BCG Cash Flow Balancing & Ansoff Diversification
Indian conglomerate ITC Limited represents one of the world's most disciplined, textbook real-world applications of the BCG Growth-Share Matrix and Ansoff's Diversification Strategy. Historically, ITC derived over 90% of its operating profits from its traditional cigarettes and tobacco division. While cigarettes represented an undisputed Cash Cow—commanding over 75% relative market share, high operating profit margins, and predictable cash flows—the industry faced terminal headwinds from aggressive government taxation, public health restrictions, and low unit growth.
Recognizing that relying on a single maturing cash cow was an existential threat, ITC's leadership launched an aggressive, multi-decade portfolio rebalancing campaign. The corporate mandate was explicit: milk the cigarette cash cow ruthlessly to fund ambitious growth vectors across the Ansoff grid.
7. AKTU University Exam Drill: Questions & Model Answers
AKTU MBA Semester Exam: Model Questions & High-Score Answers
Q1: Define 'Relative Market Share' as used in the BCG Matrix.
Model Answer: In the BCG Matrix, Relative Market Share (RMS) is the ratio of an SBU's sales volume divided by the sales volume of the single largest competitor in that industry. An RMS greater than 1.0 indicates that the SBU is the market leader, benefiting from scale economies and learning curve cost advantages; an RMS less than 1.0 indicates a market follower position.
Q2: What is the highest-risk growth vector in the Ansoff Matrix?
Model Answer: Diversification (New Products in New Markets) is the highest-risk growth vector in the Ansoff Matrix. It requires the enterprise to simultaneously develop unfamiliar technologies and manufacturing processes while navigating unknown customer behaviors, distribution channels, and competitive dynamics outside its core competencies.
Q3: Critically analyze the Boston Consulting Group (BCG) Growth-Share Matrix. Explain the four quadrants, discuss the 'Success' and 'Disaster' sequences, and evaluate its major limitations.
Model Answer Structure & Key Arguments:
- Introduction & Purpose of Portfolio Planning: Define portfolio analysis and introduce Bruce Henderson's 1968 BCG Growth-Share Matrix. Draw the 2x2 diagram clearly labeling the axes: Market Growth Rate (vertical, proxy for industry attractiveness) and Relative Market Share (horizontal, proxy for competitive cost advantage).
- Comprehensive Explanation of the Four Quadrants:
- Stars (High Growth, High Share): Market leaders requiring substantial reinvestment to expand capacity, but generating large cash flows; self-sustaining future cash cows.
- Cash Cows (Low Growth, High Share): Dominant market positions in mature industries; require minimal capital and generate immense, stable surplus cash to milk.
- Question Marks (High Growth, Low Share): Cash guzzlers operating in booming markets with weak market share; require heavy capital to build share into Stars or prompt divestment.
- Dogs (Low Growth, Low Share): Weak competitive positions in stagnant markets; generate low margins or losses; candidates for harvest, sale, or liquidation.
- The Dynamic Cash Flow Sequences:
- The Success Sequence: Cash Cow surplus profits -> Invested in high-potential Question Marks -> Transformed into dominant Stars -> Maturing into future Cash Cows.
- The Disaster Sequence: Underfunding Cash Cows causes market share erosion into Dogs; pouring cash into failing Question Marks that slump into Dogs; Stars starving and falling into Dogs.
- Critical Academic Limitations of the BCG Matrix:
- Oversimplification: Reduces complex market dynamics to just two variables (growth rate and market share).
- Ignores Synergies: Treating SBUs as standalone financial units ignores vital shared technological, supply chain, and brand linkages.
- Demotivation: Labeling divisions as "Cash Cows" or "Dogs" severely demotivates employees and managers.
- Low-growth markets can still be highly profitable for differentiated players (e.g., niche luxury).
- Corporate Indian Benchmark: Conclude by detailing ITC Limited using surplus cash flows from its cigarette Cash Cow to finance FMCG and hotel growth vectors.
Discussion & Questions
0 CommentsAcademic insights, questions, and conceptual clarifications from students & faculty.
No questions or comments yet
Have a doubt about this topic, an exam tip, or a conceptual perspective? Start the discussion below!
Leave a Comment / Ask a Question
Your email address will not be published. Required fields are marked *