
Target Costing Life Cycle Costing Quality Costing
1. Target Costing: Market-Driven Pricing & Value Engineering
Traditional pricing follows a cost-plus model: $\text{Estimated Cost} + \text{Desired Profit} = \text{Selling Price}$. In competitive global markets, customers dictate selling prices, rendering cost-plus models obsolete.
Target Costing reverses this equation. Pioneered by Japanese manufacturing leaders (notably Toyota under Genka Kikaku), it defines allowable costs based on market price expectations:
The Target Costing Identity
Cost Reduction Gap = Current Estimated Cost - Target Cost
Value Engineering (VE): A cross-functional methodology used during product design to eliminate the cost gap without compromising functional quality or customer satisfaction.
2. Life Cycle Costing (LCC): Cradle-to-Grave Product Economics
Life Cycle Costing (LCC) tracks total product costs across its complete life cycle—from initial research and development through manufacturing, warranty servicing, and end-of-life disposal.
1. Producer Life Cycle Stages
R&D / Design → Product Introduction → Growth → Maturity → Decline → Decommissioning. Up to 80% of product life cycle costs are committed during the design phase.
2. Customer Life Cycle Cost
$\text{Total Cost of Ownership (TCO)} = \text{Purchase Price} + \text{Operating Maintenance} + \text{Energy Costs} - \text{Salvage Value}$. Vital for commercial equipment buyers.
3. Quality Costing: Juran & Feigenbaum's PAF Framework
The Cost of Quality (CoQ) is categorized using the classic PAF Model (Prevention, Appraisal, Failure):
4. Strategic Cost Formulations & Solved Numerical Problem (10-Mark AKTU Parity)
Below is a comprehensive AKTU 10-mark examination problem covering Target Costing and Quality Costing calculations.
AKTU Exam Problem: Target Costing & Quality Costing Analysis
Part A (Target Costing): NexGen Mobility Ltd. is designing an electric urban delivery scooter. Market research indicates that a competitive retail selling price must be fixed at ₹ 80,000. The board requires a minimum operating profit return of 20% on sales. The current engineering design estimates manufacturing and distribution costs at ₹ 72,000 per scooter.
Part B (Quality Costing): During the year, an engineering plant incurred the following quality-related expenses:
- Quality Engineering & Preventive Training: ₹ 1,20,000
- Incoming Raw Material Lab Testing & Inspection: ₹ 1,80,000
- Internal Factory Scrap & Rework: ₹ 3,50,000
- Warranty Claim Repairs & Customer Replacements: ₹ 5,50,000
- Supplier Quality Audits: ₹ 80,000
- Finished Goods Pre-Shipment Inspection: ₹ 1,40,000
Required: (a) Compute Target Cost and the Cost Reduction Gap for NexGen Mobility; (b) Classify quality expenses into Prevention, Appraisal, Internal Failure, and External Failure, and compute Total Cost of Conformance vs. Total Cost of Non-Conformance.
Step 1: Target Costing Solution (Part A)
Desired Profit Margin (20% on Sales) = 20% × ₹ 80,000 = ₹ 16,000 per unit
Target Cost = Target Price - Target Profit = ₹ 80,000 - ₹ 16,000 = ₹ 64,000 per unit
Current Estimated Manufacturing Cost = ₹ 72,000
Cost Reduction Gap = Estimated Cost - Target Cost = ₹ 72,000 - ₹ 64,000 = ₹ 8,000 per unit
(Managerial Recommendation: Deploy Value Engineering to reduce component costs by ₹ 8,000 before initiating factory production.)
Step 2: Quality Costing PAF Classification (Part B)
• Quality Training (₹ 1,20,000) + Supplier Audits (₹ 80,000) = ₹ 2,00,000
2. Appraisal Costs:
• Raw Material Lab Testing (₹ 1,80,000) + Pre-Shipment Inspection (₹ 1,40,000) = ₹ 3,20,000
3. Internal Failure Costs:
• Factory Scrap & Rework = ₹ 3,50,000
4. External Failure Costs:
• Customer Warranty Claim Repairs = ₹ 5,50,000
Total Cost of Quality (CoQ) = ₹ 2,00,000 + ₹ 3,20,000 + ₹ 3,50,000 + ₹ 5,50,000 = ₹ 14,20,000
Cost of Conformance (Prevention + Appraisal) = ₹ 2,00,000 + ₹ 3,20,000 = ₹ 5,20,000 (36.6%)
Cost of Non-Conformance (Internal + External Failures) = ₹ 3,50,000 + ₹ 5,50,000 = ₹ 9,00,000 (63.4%)
(Strategic Insight: Non-conformance failure costs account for 63.4% of quality spend. Increasing prevention spending will reduce failure costs significantly.)
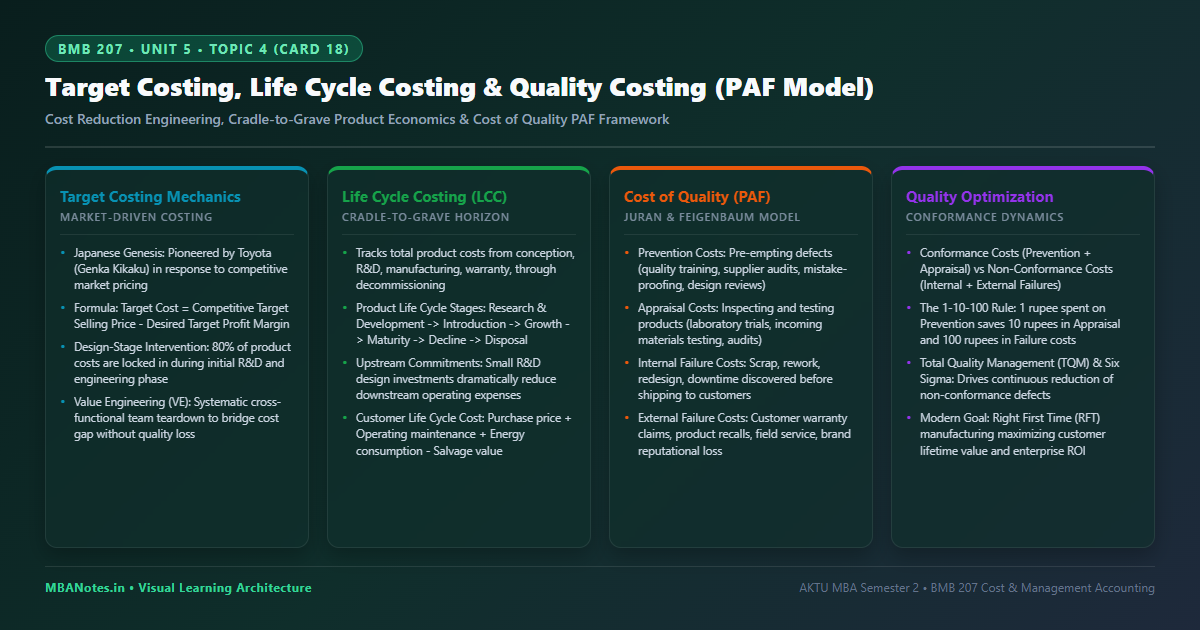
5. Visual Framework: Strategic Cost Management Triad
The visual layout below summarizes the strategic cost management triad: Target Costing Mechanics, Life Cycle Costing Horizons, and the Cost of Quality PAF Framework:
6. Corporate Case Vignette: Tata Motors Design-to-Cost & EV Life Cycle
Corporate Application: Target Costing in the Tata Punch & EV Battery Life Cycle Management
During the development of the compact SUV Tata Punch, Tata Motors Ltd. applied Target Costing. Customer research established an introductory target price of ₹ 5.49 Lakhs. Working backward with a target operating profit margin, engineering teams engaged in Value Engineering to modularize the chassis platform and share electronic modules with the Altroz.
In its electric vehicle division (Nexon EV), Tata Motors evaluates Life Cycle Costing. While lithium-ion battery packs require high initial acquisition costs, life cycle analysis accounts for lower running costs (₹ 1.2/km vs. ₹ 7.5/km for petrol) and second-life battery reuse in stationary solar grids.
Concurrently, Tata Motors applies the PAF Quality Cost model across its robotic Pune plant, increasing prevention investments in supplier quality certifications and automated optical inspections. This focus has reduced warranty failure claims and supported the company's 5-star Global NCAP vehicle safety ratings.
7. AKTU Exam Orientation: Solved Conceptual & Analytical Questions
Section A (2 Marks Conceptual Questions)
Answer: $\text{Target Cost} = \text{Target Selling Price} - \text{Target Profit Margin}$. The difference between current estimated cost and target cost represents the cost reduction gap.
Answer: Life Cycle Costing is a strategic cost management system that tracks all costs associated with a product across its entire life cycle—from initial research, design, and manufacturing through maintenance, warranty, and decommissioning.
Answer: (1) Prevention Costs; (2) Appraisal Costs; (3) Internal Failure Costs; and (4) External Failure Costs.
Answer: The 1-10-100 Rule states that spending ₹ 1 on Prevention saves ₹ 10 in Appraisal inspection costs and prevents ₹ 100 in catastrophic External Failure costs.
Section B & C (10 Marks Analytical Questions)
Structuring the 10-Mark Answer:
- Concept: Contrast traditional cost-plus pricing with market-driven target costing ($\text{Price} - \text{Profit} = \text{Cost}$).
- Implementation Process:
- Determine competitive target price through market research.
- Establish required corporate target profit margin.
- Calculate allowable target cost.
- Estimate current manufacturing and delivery cost.
- Identify the Cost Reduction Gap.
- Role of Value Engineering: Explain cross-functional component teardowns, alternative material substitution, and eliminating non-value-added design features to close the cost gap.
Structuring the 10-Mark Answer:
- The PAF Framework: Detail Prevention, Appraisal, Internal Failure, and External Failure with industrial examples.
- Conformance vs. Non-Conformance: Define Cost of Conformance ($\text{Prevention} + \text{Appraisal}$) and Cost of Non-Conformance ($\text{Internal} + \text{External Failure}$).
- Optimal Quality Trade-off: Explain that investing in prevention and appraisal reduces internal and external failure costs, lowering overall quality costs and supporting a Right First Time (RFT) operating model.
Discussion & Questions
0 CommentsAcademic insights, questions, and conceptual clarifications from students & faculty.
No questions or comments yet
Have a doubt about this topic, an exam tip, or a conceptual perspective? Start the discussion below!
Leave a Comment / Ask a Question
Your email address will not be published. Required fields are marked *