
OLAP Technology: Multidimensional Data Cubes, Core Navigational Operations, and ROLAP vs MOLAP vs HOLAP
1. Foundations and Objectives of OLAP Technology
Pioneered by Dr. E.F. Codd (the creator of the relational database model) in 1993, Online Analytical Processing (OLAP) enables business analysts, executives, and data managers to gain rapid, consistent, interactive access to a wide variety of possible views of information that has been transformed from raw enterprise operational data to reflect the real-world dimensionality of the enterprise.
2. The Multidimensional Data Cube Concept
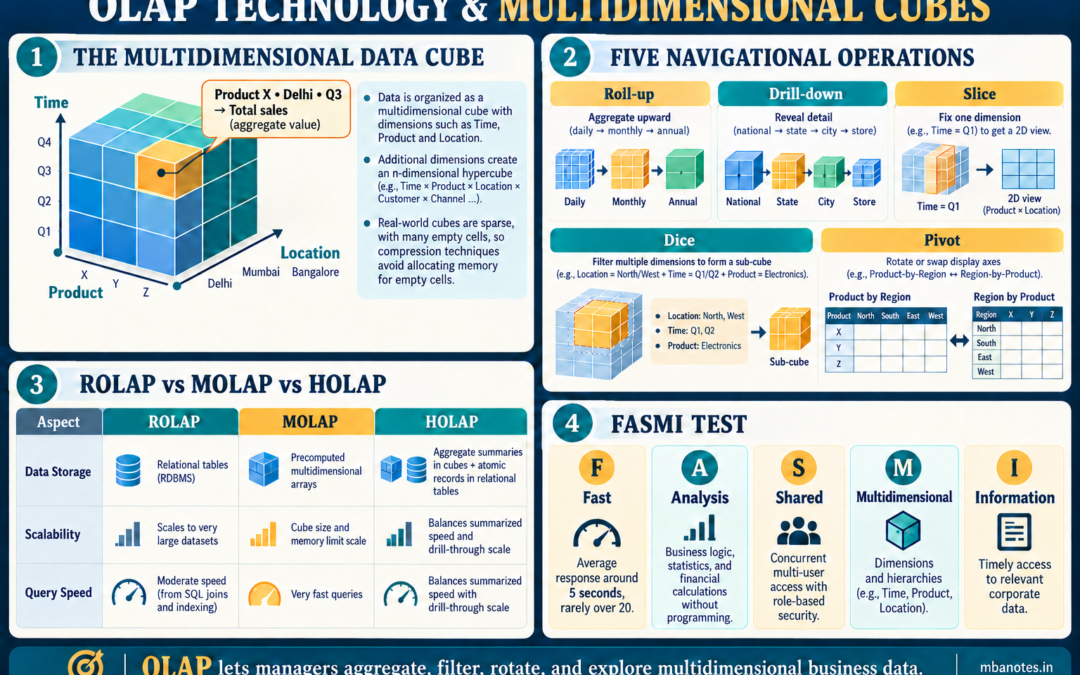
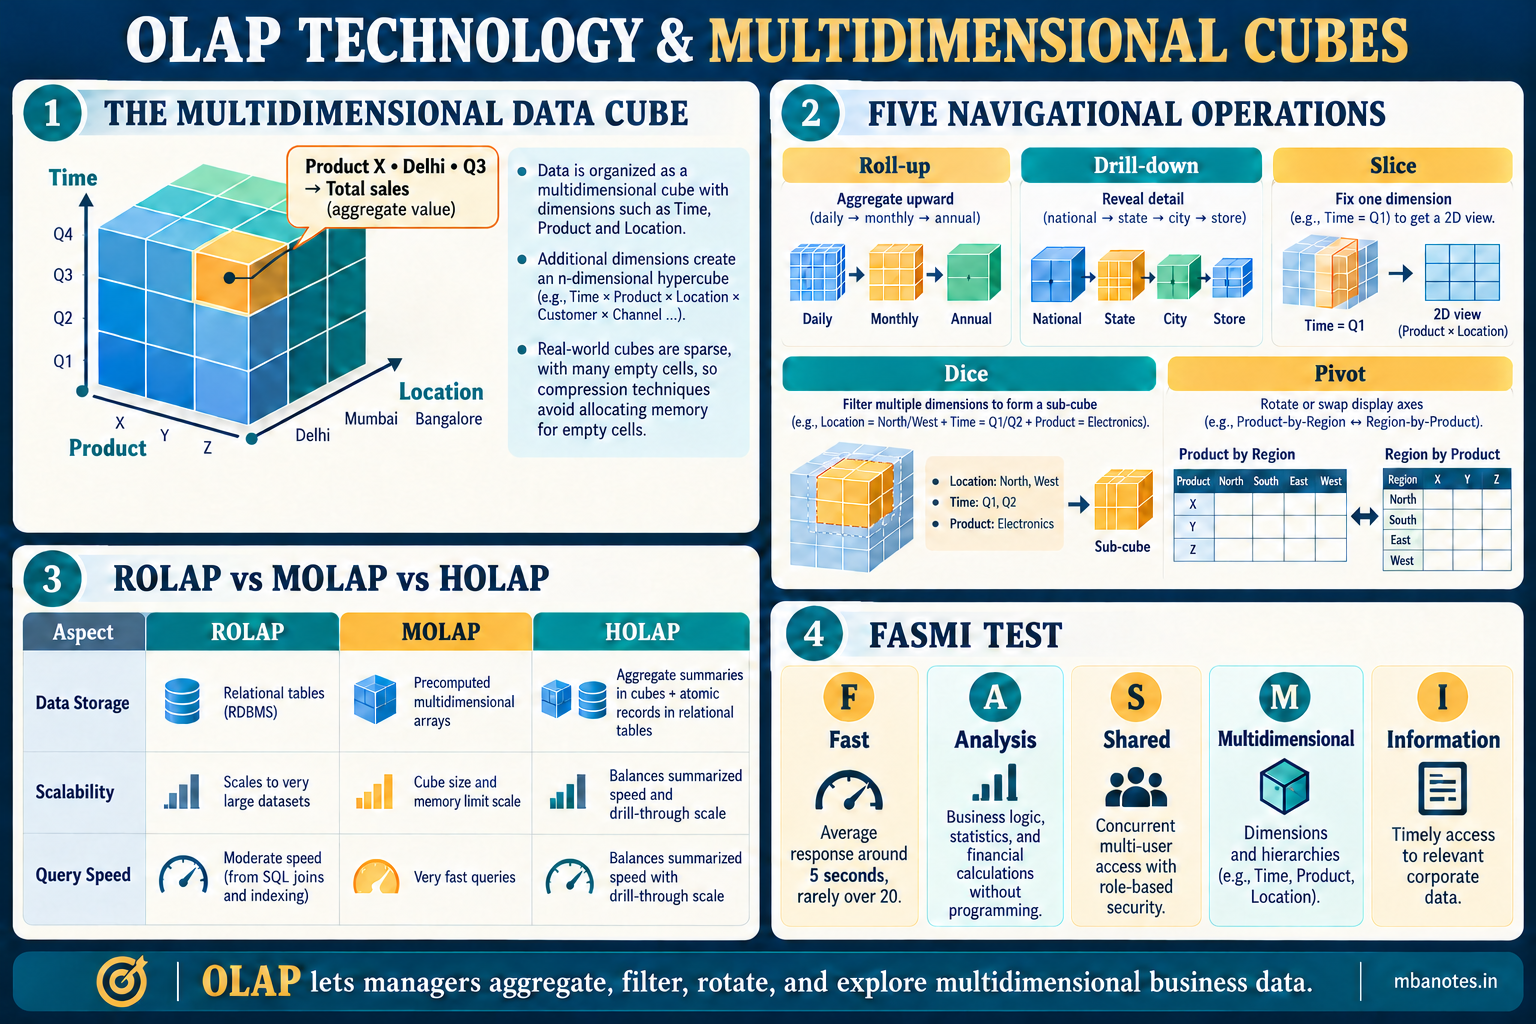
At the conceptual core of OLAP is the Data Cube. While traditional relational databases display data in two-dimensional flat tables (rows and columns), a data cube models business facts across multiple orthogonal dimensions (e.g., Time, Item/Product, Location/Store):
- Cells: The intersection of specific dimension coordinates represents a cube cell, storing pre-computed aggregate numeric measurements (e.g., total sales revenue for "Product X" in "Delhi" during "Q3 2024").
- Hypercubes: When the dimensional space extends beyond three dimensions (e.g., adding Customer Segment, Promotion Type, and Sales Channel), the data structure becomes an n-dimensional hypercube.
- Sparsity Management: Real-world hypercubes are inherently sparse (many coordinate intersections represent zero transactions, such as winter coats sold in Chennai). Modern OLAP engines utilize sophisticated sparse-matrix compression algorithms to avoid allocating memory for null cells.
3. Core Navigational OLAP Operations
OLAP empowers users to navigate through data cubes using five foundational algebraic operations:
- 1. Roll-up (Drill-Up): Performs aggregation on a data cube either by climbing up a concept hierarchy for a dimension (e.g., rolling up Daily sales into Monthly totals, and Monthly into Annual totals) or by dimension reduction (removing a dimension entirely from the cube view).
- 2. Drill-down (Roll-Down): The reverse of roll-up. It navigates from less detailed summarized data to more granular detailed records, either by stepping down a concept hierarchy (e.g., navigating from National Sales → State Sales → City Sales → Specific Store Sales) or by introducing a new dimension into the query perspective.
- 3. Slice: Performs a selection on a single dimension of the given cube, resulting in a two-dimensional sub-cube. For example, slicing the cube where
Time = "Q1 2024"filters out all other quarters, displaying Location vs Product sales for that quarter alone. - 4. Dice: Defines a sub-cube by performing a selection across two or more dimensions simultaneously. For example, executing:
(Location = "North" OR "West") AND (Time = "Q1" OR "Q2") AND (Product = "Electronics")isolates a distinct 3D cuboid from the global cube. - 5. Pivot (Rotate): Re-orients the visual display axes of the data presentation to provide an alternative perspective on the data. For example, swapping the row and column axes transforms a Product-by-Region grid into a Region-by-Product matrix.
4. Architectural Taxonomy: ROLAP versus MOLAP versus HOLAP
The physical implementation of OLAP systems falls into three primary architectural categories:
| Evaluation Parameter | Relational OLAP (ROLAP) | Multidimensional OLAP (MOLAP) | Hybrid OLAP (HOLAP) |
|---|---|---|---|
| Underlying Engine | Relational database management systems (RDBMS) | Proprietary multidimensional array storage engines | Blended RDBMS tables + array multidimensional cubes |
| Data Storage | Relational tables (Star & Snowflake schemas) | Pre-computed, densely packed multi-dimensional array cubes | Aggregates in MOLAP cubes; base atomic records in RDBMS |
| Query Performance | Moderate; query speed governed by SQL joins & indexing | Ultra-fast sub-second response times on pre-calculated cells | Fast on summarized queries; moderate on granular drill-through |
| Data Scalability | Virtually unlimited (Handles petabytes of data) | Limited by memory and cube explosion issues (Gigabytes to Terabytes) | High scalability with optimized cube performance |
| Cube Pre-computation | Dynamic SQL aggregation or materialized views | Extensive offline batch processing to pre-build cubes | Selectively pre-computes high-frequency analytical summary cubes |
5. Fast Analysis of Shared Multidimensional Information (FASMI)
The core requirements of OLAP are encapsulated by the FASMI test:
- Fast: Delivering analytical query responses to business analysts in an average of 5 seconds, rarely exceeding 20 seconds.
- Analysis: Handling intuitive business logic, statistical modeling, and financial calculations without programming.
- Shared: Implementing concurrent multi-user read/write locking and role-based data security.
- Multidimensional: Providing a conceptual multidimensional framework with full hierarchy support.
- Information: Timely access to all relevant corporate data regardless of underlying database volume.
University Examination Question Bank & Model Solutions
Designed as per Dr. A.P.J. Abdul Kalam Technical University (AKTU) MBA Examination Pattern.
Part A: Conceptual 2-Mark Short Answer Questions
Q1 [2 Marks]: Define the primary distinction relevant to OLAP Technology & Cubes in analytical system design.
Ans: It represents a core dimensional engineering and data processing paradigm governing how enterprise facts and dimensions are modeled, structured into relational schemas, or transformed via automated data integration pipelines.
Q2 [2 Marks]: What is the significance of Core OLAP Operations in data warehouse architecture?
Ans: It establishes the formal structural mechanisms—such as additive fact table metrics, denormalized star topologies, or log-based CDC—that optimize SQL query performance and data reliability.
Part B & C: Analytical 10-Mark Detailed Solutions & Technical Frameworks
Question 1
Model Examination Answer Blueprint:
Strategic Executive Summary: 7. OLAP Technology & Cubes
- Dimensional Modeling Excellence: Declaring atomic grain and employing surrogate keys to insulate the data warehouse from operational source churn.
- Schema Optimization: Selecting Star Schemas for fast departmental queries and Fact Constellations with conformed dimensions for enterprise cross-functional analytics.
- Interactive Analytical Exploration: Providing business executives with sub-second multidimensional OLAP slicing, dicing, and roll-up drill-down capabilities.
- Modern Data Pipelines: Adopting log-based Change Data Capture (CDC) and cloud-native ELT architectures to ensure continuous, reliable data delivery.
Frequently Asked Questions (Academic & Technical FAQ)
Q1. What makes OLAP Technology & Cubes critical for modern enterprise managers?
It enables organizations to structure complex enterprise data into intuitive, lightning-fast analytical models, empowering managers to make confident, data-driven decisions.
Q2. How do practitioners apply these principles in corporate environments?
Practitioners implement Kimball dimensional modeling with SCD Type 2 tracking, build Star Schemas with bitmap indexes, configure automated CDC pipelines, and deploy cloud ELT models using dbt.
Q3. What are the most frequent examination questions asked from this topic in AKTU?
AKTU examinations frequently require comparing Fact vs Dimension tables, detailing measure additivity types, comparing Star vs Snowflake vs Constellation schemas with diagrams, explaining OLAP operations (Roll-up, Drill-down, Slice, Dice, Pivot), and detailing the ETL pipeline and CDC.
Discussion & Questions
0 CommentsAcademic insights, questions, and conceptual clarifications from students & faculty.
No questions or comments yet
Have a doubt about this topic, an exam tip, or a conceptual perspective? Start the discussion below!
Leave a Comment / Ask a Question
Your email address will not be published. Required fields are marked *