
Poisson and Exponential Distribution in Queuing Systems & Economic Optimization of Service Facilities
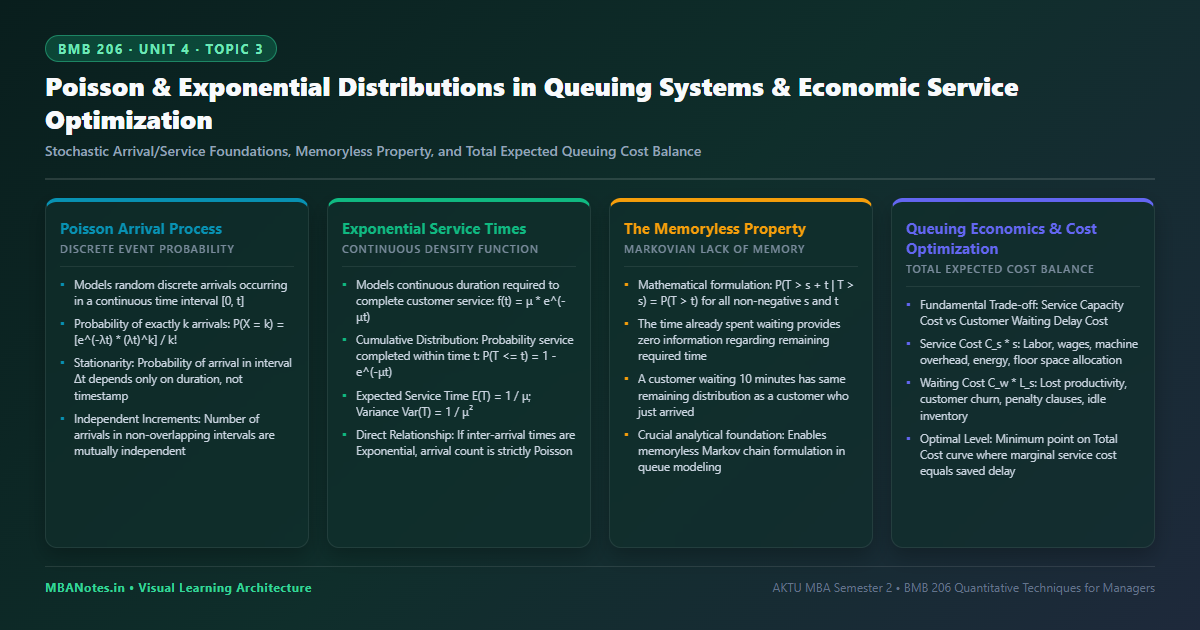
1. The Poisson Arrival Model: Axioms & Mathematical Properties
In real-world business and service systems, arrivals occur randomly rather than on rigid clockwork schedules. The Poisson process represents the quintessential stochastic model for counting discrete random events occurring over continuous time.
- Axiom of Stationarity (Homogeneity): The probability that an event occurs within a tiny time increment $\Delta t$ depends solely on interval length $\Delta t$ and mean rate $\lambda$, completely independent of the starting time $t$: $P(1\text{ arrival in }\Delta t) = \lambda \Delta t + o(\Delta t)$.
- Axiom of Non-Simultaneity (Orderliness): The probability of two or more simultaneous arrivals occurring within an infinitesimal interval $\Delta t$ is negligible: $P(\ge 2\text{ arrivals in }\Delta t) = o(\Delta t) \to 0$.
- Axiom of Independent Increments (Markovian Independence): The number of arrivals occurring in any two non-overlapping time intervals are statistically independent. Past arrival volume imparts zero predictive power on future arrival volume.
- Poisson Probability Mass Function: The probability that exactly $k$ entities arrive during a fixed observation window of duration $t$ is: $$P(X = k) = \frac{e^{-\lambda t}(\lambda t)^k}{k!} \quad \text{for } k = 0, 1, 2, \dots$$
- Equivalence of Mean and Variance: For any Poisson arrival distribution, the expected value and the variance are strictly identical: $E(X) = \text{Var}(X) = \lambda t$.
2. Negative Exponential Service Times & The Memoryless Theorem
While arrivals represent discrete event counts, service duration is a continuous random variable $T$. When arrivals follow a Poisson distribution with parameter $\lambda$, the elapsed time between consecutive arrivals (inter-arrival time) is mathematically proven to follow a Negative Exponential distribution with parameter $\lambda$. Similarly, service duration across varied transactions is modeled via the Exponential distribution:
- Probability Density Function (PDF): $f(t) = \mu e^{-\mu t}$ for $t \ge 0$, where $\mu$ denotes the mean service completion rate per unit time.
- Cumulative Distribution Function (CDF): The probability that a service operation completes within time $t$ is: $$P(T \le t) = int_0^t \mu e^{-\mu x} dx = 1 - e^{-\mu t}$$
- Tail Survival Function: The probability that service requires more than time $t$ is $P(T > t) = e^{-\mu t}$.
- Expected Value & Variance: Mean service time is $E(T) = (1 / \mu)$, and variance is $\text{Var}(T) = (1 / \mu^2)$.
- The Memoryless (Markovian) Property: The Negative Exponential distribution is the only continuous probability distribution that possesses complete lack of memory. Formally: $$P(T > s + t \mid T > s) = (P(T > s + t) / P(T > s)) = \frac{e^{-\mu(s + t)}}{e^{-\mu s}} = e^{-\mu t} = P(T > t)$$ Managerial Implication: The fact that a transaction has already been in progress for $s$ minutes gives zero predictive information regarding how much further time will be required to finish. The remaining duration has the exact same probability distribution as a brand new transaction.
3. Economic Analysis of Queuing Systems: The Cost Trade-off Model
From an executive management standpoint, queuing models exist to resolve an economic conflict between two opposing cost curves:
- Cost of Providing Service Capacity ($C_s cdot s$): The direct capital, operational, and labor expenditures required to install and maintain service channels (e.g., teller salaries, automated machinery, maintenance, server hardware). This cost increases linearly with the number of servers or service speed $\mu$.
- Cost of Customer Waiting ($C_w cdot L_s$): The tangible and intangible losses incurred due to delay (e.g., driver idle wages, in-transit inventory holding costs, customer frustration, brand abandonment, penalty clauses). This cost is a convex decreasing function of capacity.
- Total Expected System Cost Function ($\text{TEC}$): $$\text{TEC}(s) = \text{Total Service Cost} + \text{Total Waiting Cost} = (C_s \times s) + (C_w \times L_s)$$
- Optimal Economic Service Capacity ($s^*$): The service capacity or number of channels that minimizes Total Expected Cost ($\text{TEC}$), occurring precisely at the inflection point where marginal service investment equals marginal reduction in waiting penalties.
Queuing Economics Formulation & Solved Step-by-Step Numerical
Cost Optimization A multimodal logistics container terminal receives heavy transport trucks at an average rate of $\lambda = 4$ trucks per hour according to a Poisson arrival process. The terminal management is evaluating two alternative crane facilities to handle truck unloading:
• Option A (Standard Electric Crane): Service rate $\mu_A = 5$ trucks per hour. Operating lease cost $C_{sA} = \mathbf{\text{₹}600\text{ per hour}}$.
• Option B (High-Speed Automated Crane): Service rate $\mu_B = 8$ trucks per hour. Operating lease cost $C_{sB} = \mathbf{\text{₹}1,100\text{ per hour}}$.
The cost of truck idling (driver idle wages + tractor lease cost) is estimated at $C_w = \text{₹}1,200\text{ per truck per hour}$. The logistics hub operates 10 active working hours daily.
Required: Determine the average number of trucks in the system ($L_s$), average waiting time ($W_s$), hourly Total Expected Cost ($\text{TEC}$), and total daily operating cost for both options. Provide an actionable managerial recommendation.
Strict Step-by-Step Mathematical Analysis:
1. Server Utilization: $ \rho_A = (\lambda / \mu_A) = (4 / 5) = 0.80$ ($80\%$ busy)
2. Average Trucks in System: $$L_{sA} = (\lambda / \mu_A - \lambda) = (4 / 5 - 4) = (4 / 1) = \mathbf{4\text{ trucks}}$$ 3. Average Time Spent per Truck in Hub: $$W_{sA} = (1 / \mu_A - \lambda) = (1 / 5 - 4) = 1\text{ hour} = \mathbf{60\text{ minutes}}$$ 4. Hourly Cost Breakdown: $$\text{Service Capacity Cost} = C_{sA} = \text{₹}600/\text{hr}$$ $$\text{Waiting Cost} = C_w \times L_{sA} = 1200 \times 4 = \text{₹}4,800/\text{hr}$$ $$\text{Total Expected Cost per Hour } (\text{TEC}_A) = 600 + 4,800 = \mathbf{\text{₹}5,400\text{ per hour}}$$ 5. Daily Total Cost (10 hours): $5,400 \times 10 = \mathbf{\text{₹}54,000\text{ per day}}$
Part 2: Evaluation of Option B (High-Speed Automated Crane: $\mu_B = 8\text{ trucks/hr}$)
1. Server Utilization: $ \rho_B = (\lambda / \mu_B) = (4 / 8) = 0.50$ ($50\%$ busy)
2. Average Trucks in System: $$L_{sB} = (\lambda / \mu_B - \lambda) = (4 / 8 - 4) = (4 / 4) = \mathbf{1\text{ truck}}$$ 3. Average Time Spent per Truck in Hub: $$W_{sB} = (1 / \mu_B - \lambda) = (1 / 8 - 4) = (1 / 4)\text{ hour} = \mathbf{15\text{ minutes}}$$ 4. Hourly Cost Breakdown: $$\text{Service Capacity Cost} = C_{sB} = \text{₹}1,100/\text{hr}$$ $$\text{Waiting Cost} = C_w \times L_{sB} = 1200 \times 1 = \text{₹}1,200/\text{hr}$$ $$\text{Total Expected Cost per Hour } (\text{TEC}_B) = 1,100 + 1,200 = \mathbf{\text{₹}2,300\text{ per hour}}$$ 5. Daily Total Cost (10 hours): $2,300 \times 10 = \mathbf{\text{₹}23,000\text{ per day}}$
Part 3: Comparative Economic Decision Matrix & Recommendation
• Hourly Economic Savings = $\text{TEC}_A - \text{TEC}_B = \text{₹}5,400 - \text{₹}2,300 = \mathbf{\text{₹}3,100\text{ per hour}}$
• Daily Economic Savings = $\text{₹}54,000 - \text{₹}23,000 = \mathbf{\text{₹}31,000\text{ per day}}$ ($57.4\%$ net reduction)
• Average Turnaround Time Reduction: Dropped from 60 minutes to 15 minutes (a $75\%$ turnaround speedup).
Executive Recommendation: Even though the high-speed crane incurs an additional $\text{₹}500$/hour in direct equipment leasing, it collapses waiting trucks from 4 to 1, slashing truck idling penalties by $\text{₹}3,600$/hour. The terminal should immediately deploy Option B, yielding a verified annual net cost savings exceeding $\text{₹}93\text{ Lakhs}$ across 300 operating days.
4. Comparative Analysis: Deterministic vs. Stochastic Queues
Understanding why queues build up even when capacity exceeds demand requires contrasting deterministic models with stochastic waiting realities:
| System Dimension | Deterministic Model ($D/D/1$) | Markovian Stochastic Model ($M/M/1$) | Managerial Implication |
|---|---|---|---|
| Arrival Uniformity | Constant, clockwork arrivals at exact intervals $1/\lambda$ | Random, bursty clustering governed by Poisson probability | Surge arrivals temporarily saturate server even when $\lambda < \mu$ |
| Service Uniformity | Exact, unchanging processing duration $1/\mu$ per job | Exponential duration variance ($\text{Var} = 1/\mu^2$) | Complex transactions tie up channels, causing queue buildup |
| Queue Formation at $\rho = 0.8$ | Zero queue! Line length $L_q = 0$; wait time $W_q = 0$ | Substantial line! $L_q = 3.2$ units; $W_q = 16$ minutes | Standard capacity formulas fail; stochastic math is mandatory |
| Buffer Utilization | Predictable; zero physical buffer space required | Dynamic buffer required to prevent spillover/balking | Facility design must incorporate physical queue staging areas |
6. Corporate Case Vignette: Logistics Hub Container Cranes
DP World Nhava Sheva: Container Freight Yard Congestion Mitigation
At the Nhava Sheva international container gateway in Navi Mumbai, incoming flatbed trucks arriving to retrieve import containers experienced an average queue delay of 1.4 hours at inbound transfer bays. Arrivals followed a Poisson distribution with an hourly average of $\lambda = 15$ trucks. Yard cranes operated at $\mu = 18$ containers per hour. Fleet carriers billed demurrage penalties of ₹1,800 per idle truck hour.
DP World management conducted an economic queuing audit. Modeling the installation of optical character recognition (OCR) automated gate scanning increased service capacity to $\mu = 25$ trucks per hour at an hourly capital amortized cost of ₹1,400. The queuing delay contracted from 1.4 hours to $W_q = 15 / [25 \times 10] = 0.06\text{ hours} \approx 3.6\text{ minutes}$. Aggregate demurrage claims plunged by 92%, resulting in net savings of ₹42,000 per working shift.
7. AKTU University Examination Question Bank
Q1: Explain the ‘Memoryless Property’ of the exponential service distribution.
Model Answer: The memoryless property states that $P(T > s + t \mid T > s) = P(T > t)$. This means the probability that a service takes an additional $t$ minutes is completely independent of the time $s$ already elapsed. The server has no memory of how long it has been servicing the current customer.
Q2: What is the economic objective function in queuing facility design?
Model Answer: The economic objective is to minimize Total Expected System Cost: $\text{TEC} = (C_s \times s) + (C_w \times L_s)$, finding the optimal capacity level where the cost of adding service speed equals the monetary savings from reduced customer waiting delay.
Q3: Discuss the relationship between Poisson arrival distribution and Exponential inter-arrival times. Solve an economic optimization problem to decide between two server speeds given arrival rate $\lambda = 3$/hr, speeds $\mu_1 = 4$/hr, $\mu_2 = 6$/hr, service cost $C_s = \text{₹}200$ and $\text{₹}350$/hr, and waiting cost $C_w = \text{₹}500$/hr.
Exam Strategy: Prove mathematically that if number of arrivals in time $t$ is Poisson with rate $\lambda$, then the time interval $T$ between arrivals has CDF $P(T \le t) = 1 - e^{-\lambda t}$. Then compute $L_s$ for both speeds: $L_{s1} = 3/(4-3) = 3$, $L_{s2} = 3/(6-3) = 1$. Calculate $\text{TEC}_1 = 200 + 500(3) = \text{₹}1,700$/hr, $\text{TEC}_2 = 350 + 500(1) = \text{₹}850$/hr. Recommend Server 2 with ₹850/hr savings.
Discussion & Questions
0 CommentsAcademic insights, questions, and conceptual clarifications from students & faculty.
No questions or comments yet
Have a doubt about this topic, an exam tip, or a conceptual perspective? Start the discussion below!
Leave a Comment / Ask a Question
Your email address will not be published. Required fields are marked *